
Intro 👋🏽
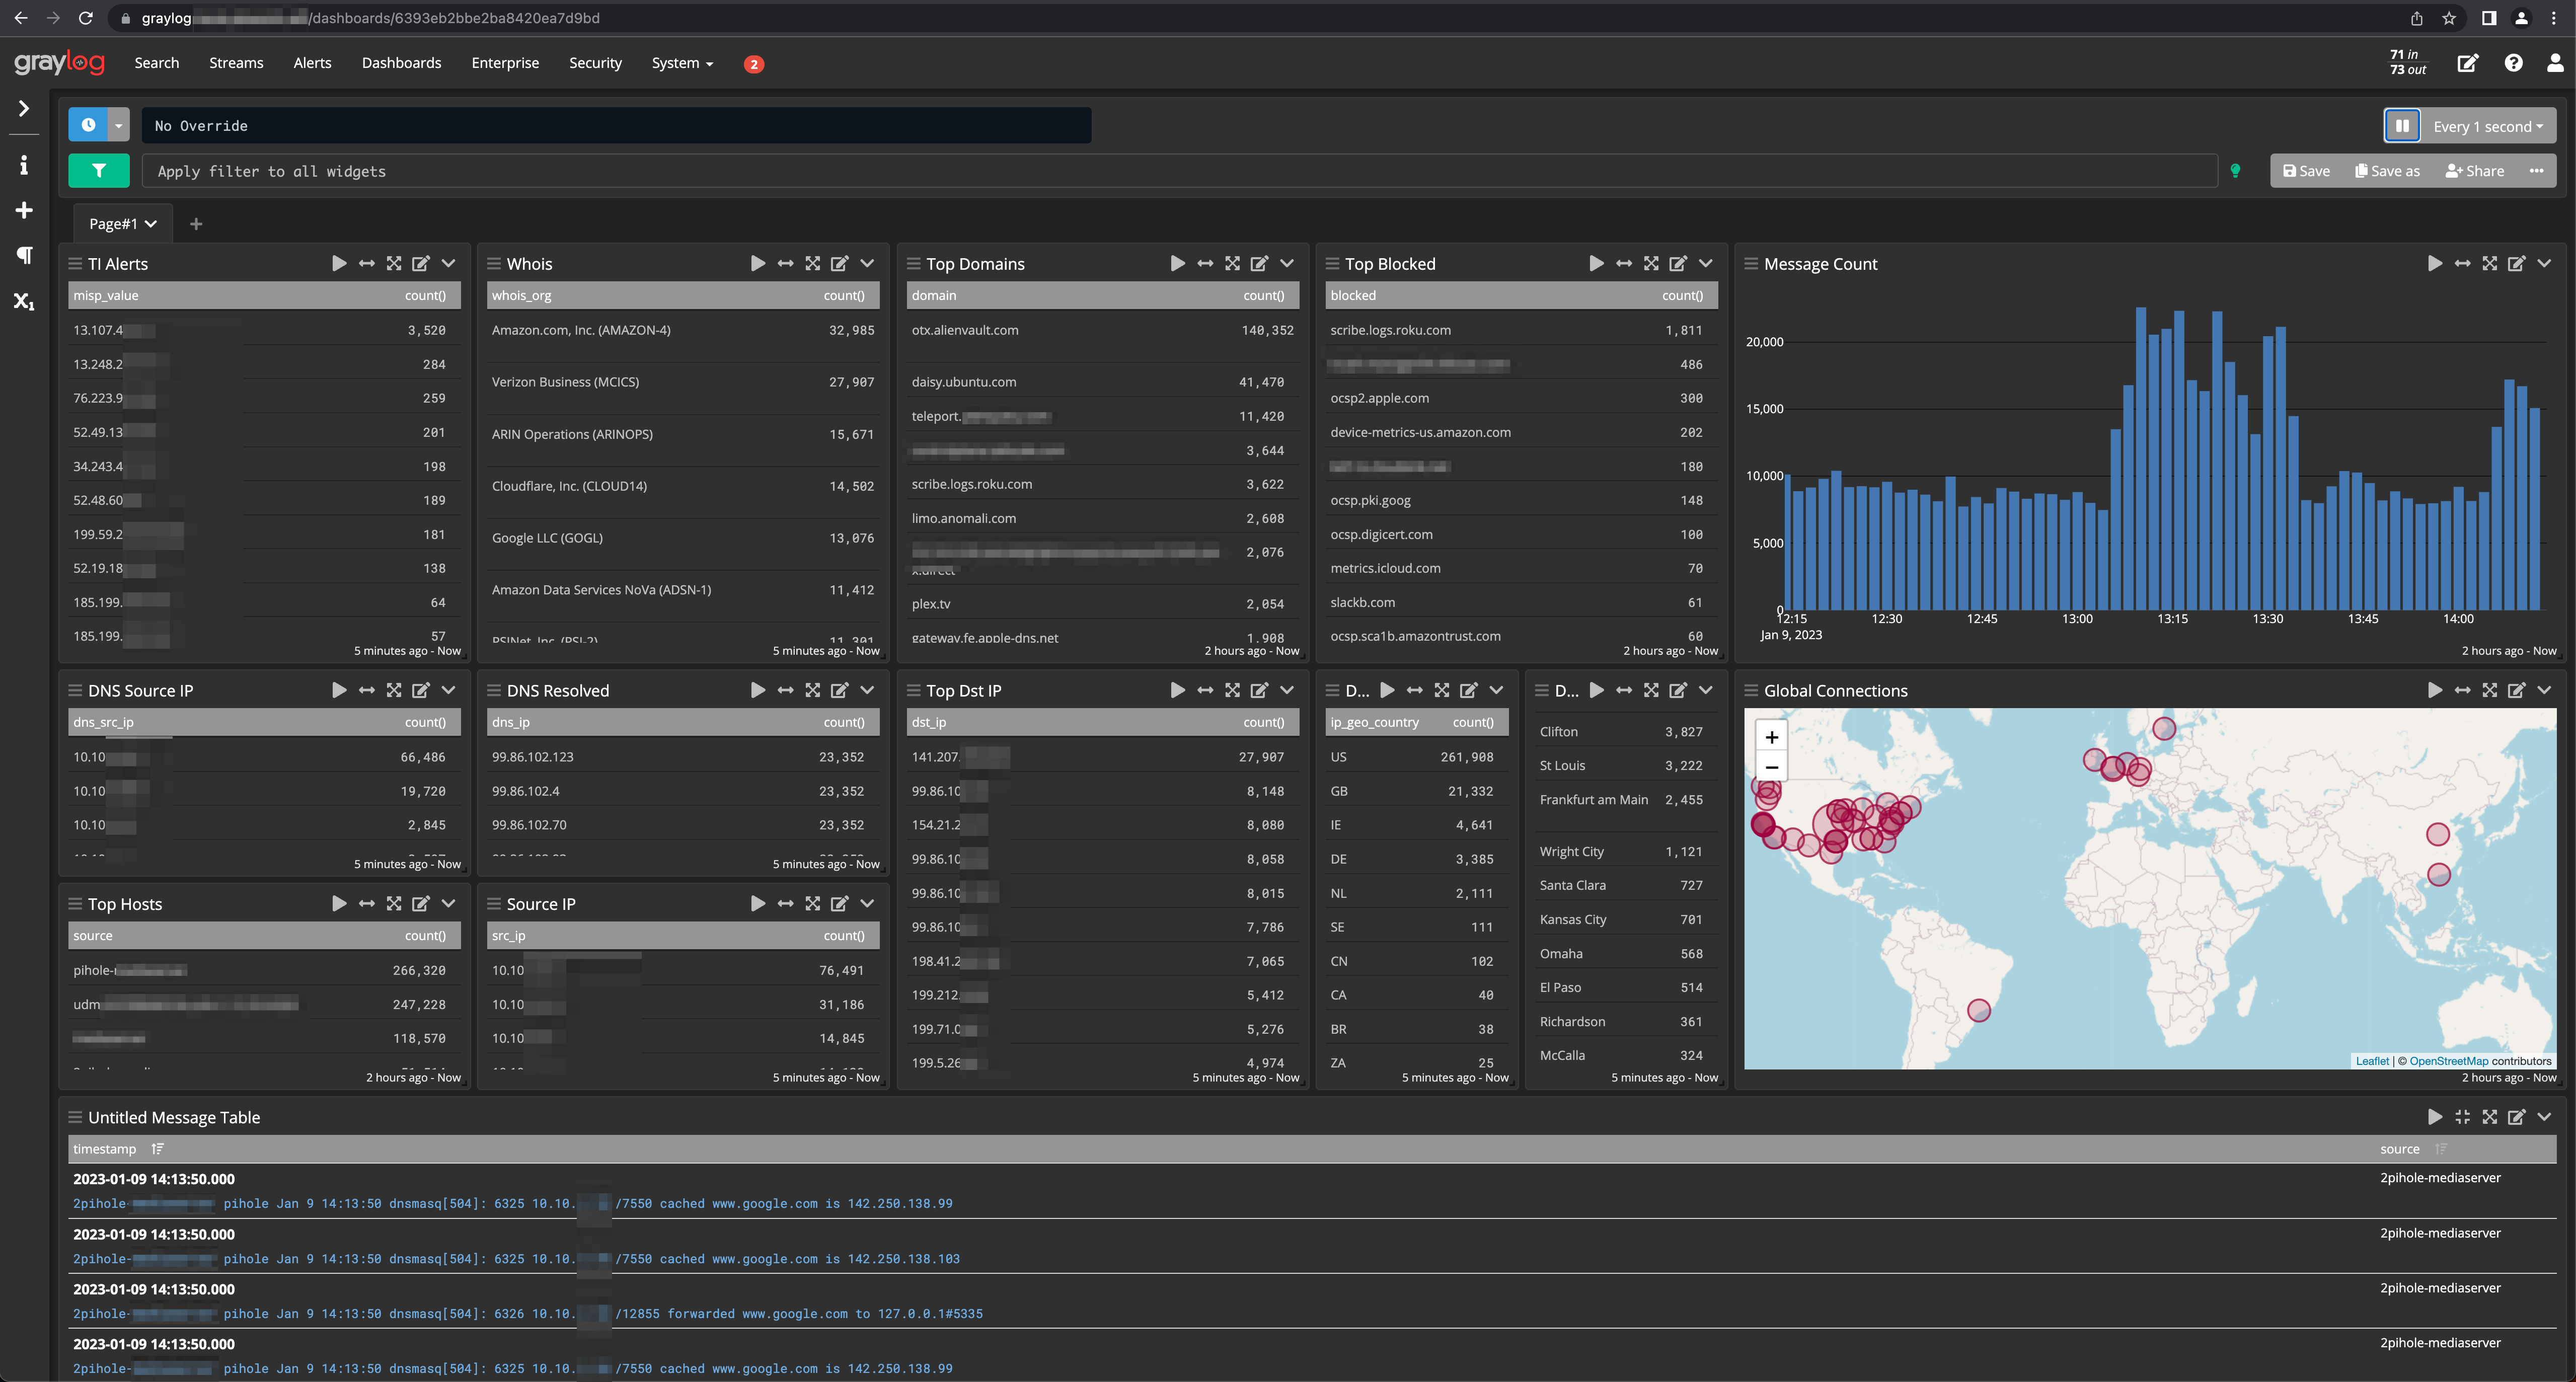
Welcome back! Today we are going to be wrapping up the network monitoring at home portion of this series. The goal is to pick up where we left off with the first piece. We’re going to go over a lot, so buckle up - by the end of this, you should be positioned to have a dashboard such as (hopefully better) this one:
Alright, let’s get to it!
Pipelines, Pipelines, and Moar Pipelines 🪠
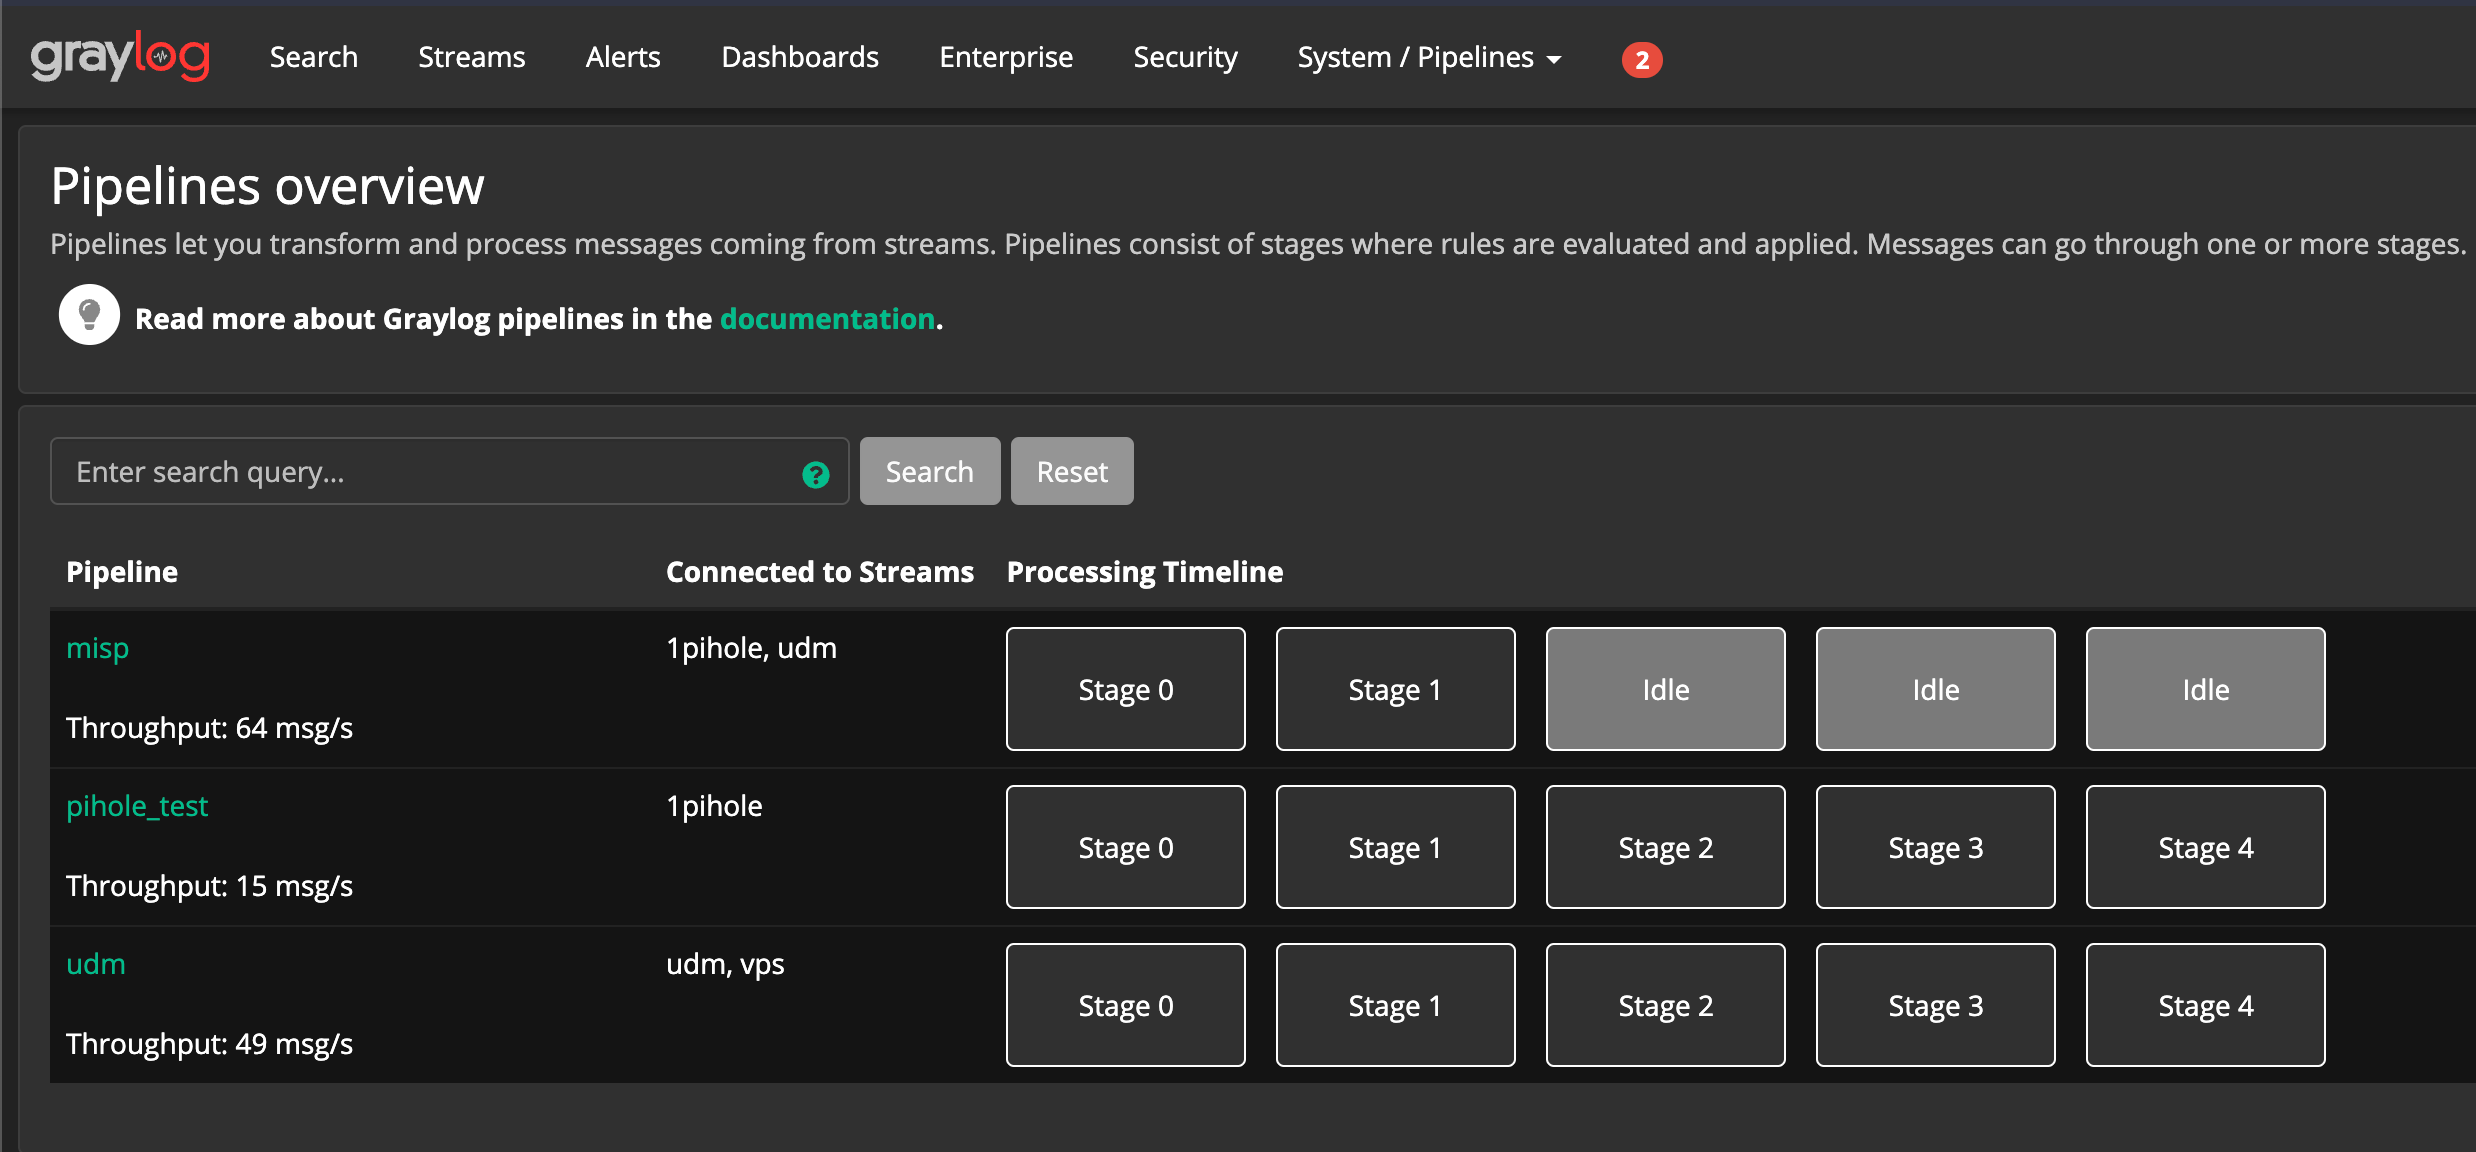
In the previous post, we chatted about creating a pipeline to extract an IP from a Syslog message. We will build on this to do … a lot more. Here’s a glimpse of what my pipelines look like on my home network in addition to the MISP pipeline built as part of this blog series:
Most of what I’m presenting here isn’t novel but rather pieced together from others via other blogs, Stack Exchange, Github Issues, etc. It’s all about standing on the shoulders of giants and paying it forward! I try to give credit where its due so please call me out if you see someone / something I’ve missed and I’ll be sure to include.
Unprecedented New Normalization 😷
A few assumptions are going to be made throughout this article. The data I am working with is coming from several Pi-Hole DNS servers I have on my network. Additionally, a second data stream has been setup for my Unified Dream Machine Pro (UDM Pro or just “UDM”).
You don’t need to have this exact setup, feel free to use any system or platform you have that supports Syslog. You may need to adjust some of the patterns and parameters accordingly depending on the vendor. If you’ve ever managed a database, “data normalization” is a term that’s likely all too familiar. When we’re trying to find meaning in data from multiple data sources, there is a high likelihood that:
- Each source has a common dataset we’re interested in
- Each source is in different formats or inconsistently labeled amongst platforms
What does this mean? Let me give you an example. Ubiquiti might label a “destination ip” as “dst-ip” whereas Raspbian (embedded Linux OS distro for the Raspberry-Pi) labels the same thing as “dst_ip”. Because these Syslog fields are different, we need to figure out a way of normalizing this data and therefore a choice needs to be made - is it “dst_ip” or “dst-ip”?!
Spoiler alert, the answer: the choice is whatever the heck you want it to be! This is the best part about self-hosting and self-serving systems, you’re enabled to selfishly blaze your own trail in terms of design decisions. Different scenario if you’re building this out for your startup or small biz you’re supporting, but you get the idea.
Log Aggregation and Correlation Methodology 🕉️
Remember: any type of processing or log record enrichment taxes your stack. The idea is to enable scalability to where we have the potential to receive 1,000s of records per second. By not introducing logic to specify which records are to be processed, we’re inefficiently using our system and unnecessarily increasing system overhead. Think of it like driving down the highway in second gear at 10000 RPMs.
When you’re putting together logging infrastructure, you slowly peel away at the layers like an onion. Each layer you should be whittling closer towards meaningful and actionable log data. The whittling is going to be done for us via data tables, the source of our lookups to be cross referenced with our incoming logs, and pipelines, the logic instructing Graylog when to perform a lookup and what to return.
Specific to Graylog, this article does a great job of explaining this process as it pertains to threat intelligence feeds and lookups. I highly recommend reviewing this before moving forward.
Laying the Pipeline 🚰
Eric Capuano from Recon Infosec, also a native Texan 🤠 , wrote a great series that can be found here that goes over some pipeline formatting which we’ll be making some references. Shoutout to Eric!
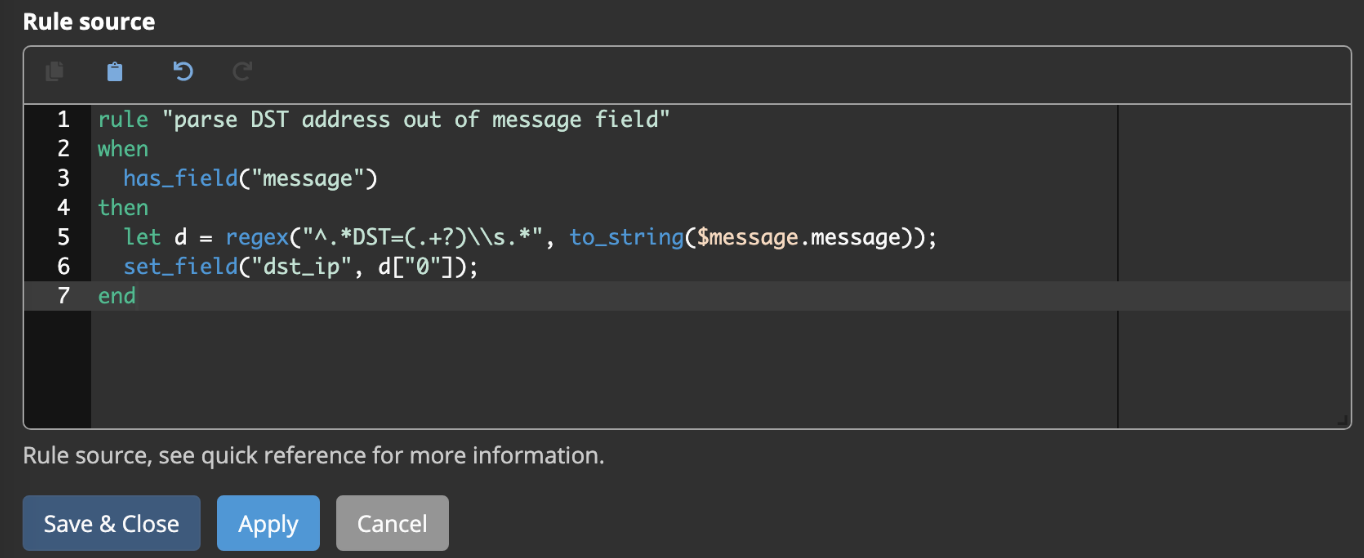
Let’s go back in to our Graylog pipelines and start with normalizing data, where we extract an IP from a Ubiquiti syslog input to match what we configured for Pi-Hole:
1
2
3
4
5
6
7
rule "parse DST address out of message field"
when
  has_field("message")
then
  let d = regex("^.*DST=(.+?)\\s.*", to_string($message.message));
  set_field("dst_ip", d["0"]);
end
For your reference, it should look something like this:
Note ⚠️: consider adding an additional rule for src_ip as well.
Next, let’s add a field that indicates whether a source IP or a destination IP is an internal (RFC1918) IP or an external IP. Only including the rule source here since we should be on the same page now with screenshot above.
1
2
3
4
5
6
7
8
9
10
11
12
13
14
15
16
rule "enrichment rfc1918 dst_ip"
when
	has_field("dst_ip")
	AND
	( // rfc1918
		cidr_match("10.0.0.0/8", to_ip($message.dst_ip))
		OR
		cidr_match("172.16.0.0/12", to_ip($message.dst_ip))
		OR
		cidr_match("192.168.0.0/16", to_ip($message.dst_ip))
		OR
		cidr_match("127.0.0.0/8", to_ip($message.dst_ip))
	)
then
	set_field("dst_ip_is_internal", true);
end
Note ⚠️: this is an example of performing this action in line in the pipeline config but understand this could also be done through a lookup table. I am unsure what the performance differences are here, but since it’s a small list it makes sense in my mind to have the logic take place in line on the pipeline config.
Our plan is to leverage the pipeline above to say “hey Graylog, any record that isn’t tagged as an internal IP, do … something”. Now let’s define something.
Lookup Tables and Data Adapters 👀
Lookup tables enable you to store and locally host a table of data that can be used to return values based off a particular criteria. This could be a Boolean value, a “true” or “false” of whether or not something exists in the table. It could be a return of a particular field from the table. Regardless, idea (for us) is to create a field to be stored based off logic configured.
Data Adapters are Graylog’s bridge between your UI / Pipelines and Lookup Tables. However, Data Adapters by way of Lookup Tables can also be used to interact with non-locally hosted, remote API endpoints. In the latter context, they are a bridge between your local instance and remote services you might want to retrieve information from.
What is “something”? These will be lookup tables that say if an IP is external, refer to the lookup table and return a value. Here will be some of the lookup tables we’re going to define:
- GeoIP
- Cisco Umbrella Top 1000
- MISP Enrichment
- Potentially other lookups (Alienvault OTX)
Alright let’s create our first table!
GeoIP 🗺
Graylog has some wonderfully written documentation on how to set this up that can be found here. GeoIP enables you to create some sexy dashboards that are interesting and can sorta be helpful during triage. But mostly adds the Threatbutt-esque flare thats obligitory for any SOC that considers itself legitimate. 😛
Cisco Umbrella Top 1000 ☂
Goal here is we are going to download a list that the Umbrella team at Cisco has put together. We are going to host it locally as a lookup table. For setting this up, refer to this article.
Now we are saying: “hey Graylog, any record that isn’t tagged as an internal IP and isn’t tagged as an Umbrella top 1k host, do … something”. Now let’s continue defining something but for real this time!
MISP 🔎
I’m going to take a little more time with this section since it’s not as well publically documented as some other areas as it pertains to Graylog.
MISP is an open source Cyber Threat Inteligence platform that is used to store data sets known as feeds in a single, centralized location. While MISP hasn’t much to do with Graylog, it’s actually kinda similar to self-hosted lookup tables but on steroids.
MISP enables you to store your tables, feeds, etc. and has an API out of the box that can be used for interacting with the stored data. This works great for our pipelines since we can dynamically make API calls to MISP to check if a value exists in a feed and/or return a value.
Configuring MISP 🔧
Similar to our Graylog stack, we are going to be running MISP in a Docker container via Docker-Compose. Before we get started, lets create our secrets.
1
2
3
4
5
docker swarm init
echo thisismymysqlpw | docker secret create MYSQL_PASSWORD -
echo thisismymysqlrootpw | docker secret create MYSQL_ROOT_PASSWORD -
echo thisismymispadminpassphrase | docker secret create MISP_ADMIN_PASSPHRASE -
docker secret ls
Our docker-compose.yml will look something like the following using the secrets we created above (don’t forget to change the IP address to the IP address of the docker host):
1
2
3
4
5
6
7
8
9
10
11
12
13
14
15
16
17
18
19
20
21
22
23
24
25
26
27
28
29
30
31
32
33
34
35
36
37
38
39
40
41
42
43
44
45
46
47
48
49
50
51
52
53
54
55
56
57
58
59
60
61
62
63
64
version: '3'
services:

  redis:
    image: redis:5.0.6
    restart: unless-stopped

  db:
    image: mysql:8.0.19
    command: --default-authentication-plugin=mysql_native_password
    container_name: mysqlmisp
    restart: always
    secrets:
      - MYSQL_PASSWORD
      - MYSQL_ROOT_PASSWORD
    environment:
      - "MYSQL_USER=misp"
      - "MYSQL_PASSWORD=/run/secret/MYSQL_PASSWORD"
      - "MYSQL_ROOT_PASSWORD=/run/secret/MYSQL_ROOT_PASSWORD"
      - "MYSQL_DATABASE=misp"
    volumes:
      - /path/to/docker/mysql/folder:/var/lib/mysql
    cap_add:
      - SYS_NICE  # CAP_SYS_NICE Prevent runaway mysql log

  misp:
    image: coolacid/misp-docker:core-latest
    restart: unless-stopped
    depends_on:
      - redis
      - db
    ports:
      - "8081:80"
      - "8443:443"
    volumes:
      - "/path/to/docker/folder/server-configs/:/var/www/MISP/app/Config/"
      - "/path/to/docker/folder/logs/:/var/www/MISP/app/tmp/logs/"
      - "/path/to/docker/folder/files/:/var/www/MISP/app/files"
      - "/path/to/docker/folder/ssl/:/etc/nginx/certs"
    secrets:
      - MISP_ADMIN_PASSPHRASE
    environment:
      - "HOSTNAME=https://IP_ADDRESS_GOES_HERE:8443"
      - "REDIS_FQDN=redis"
      - "MISP_ADMIN_PASSPHRASE=/run/secret/MISP_ADMIN_PASSPHRASE"
      - "INIT=true"             # Initialze MISP, things includes, attempting to import SQL and the Files DIR
      - "CRON_USER_ID=1"        # The MISP user ID to run cron jobs as

  misp-modules:
    image: coolacid/misp-docker:modules-latest
    restart: unless-stopped
    environment:
      - "REDIS_BACKEND=redis"
    depends_on:
      - redis
      - db

secrets:
  MYSQL_PASSWORD:
    external: true
  MYSQL_ROOT_PASSWORD:
    external: true
  MISP_ADMIN_PASSPHRASE:
    external: true
Deploy the stack:
1
2
docker stack deploy --compose-file /path/to/docker-compose.yml mispstack
docker stack ps mispstack
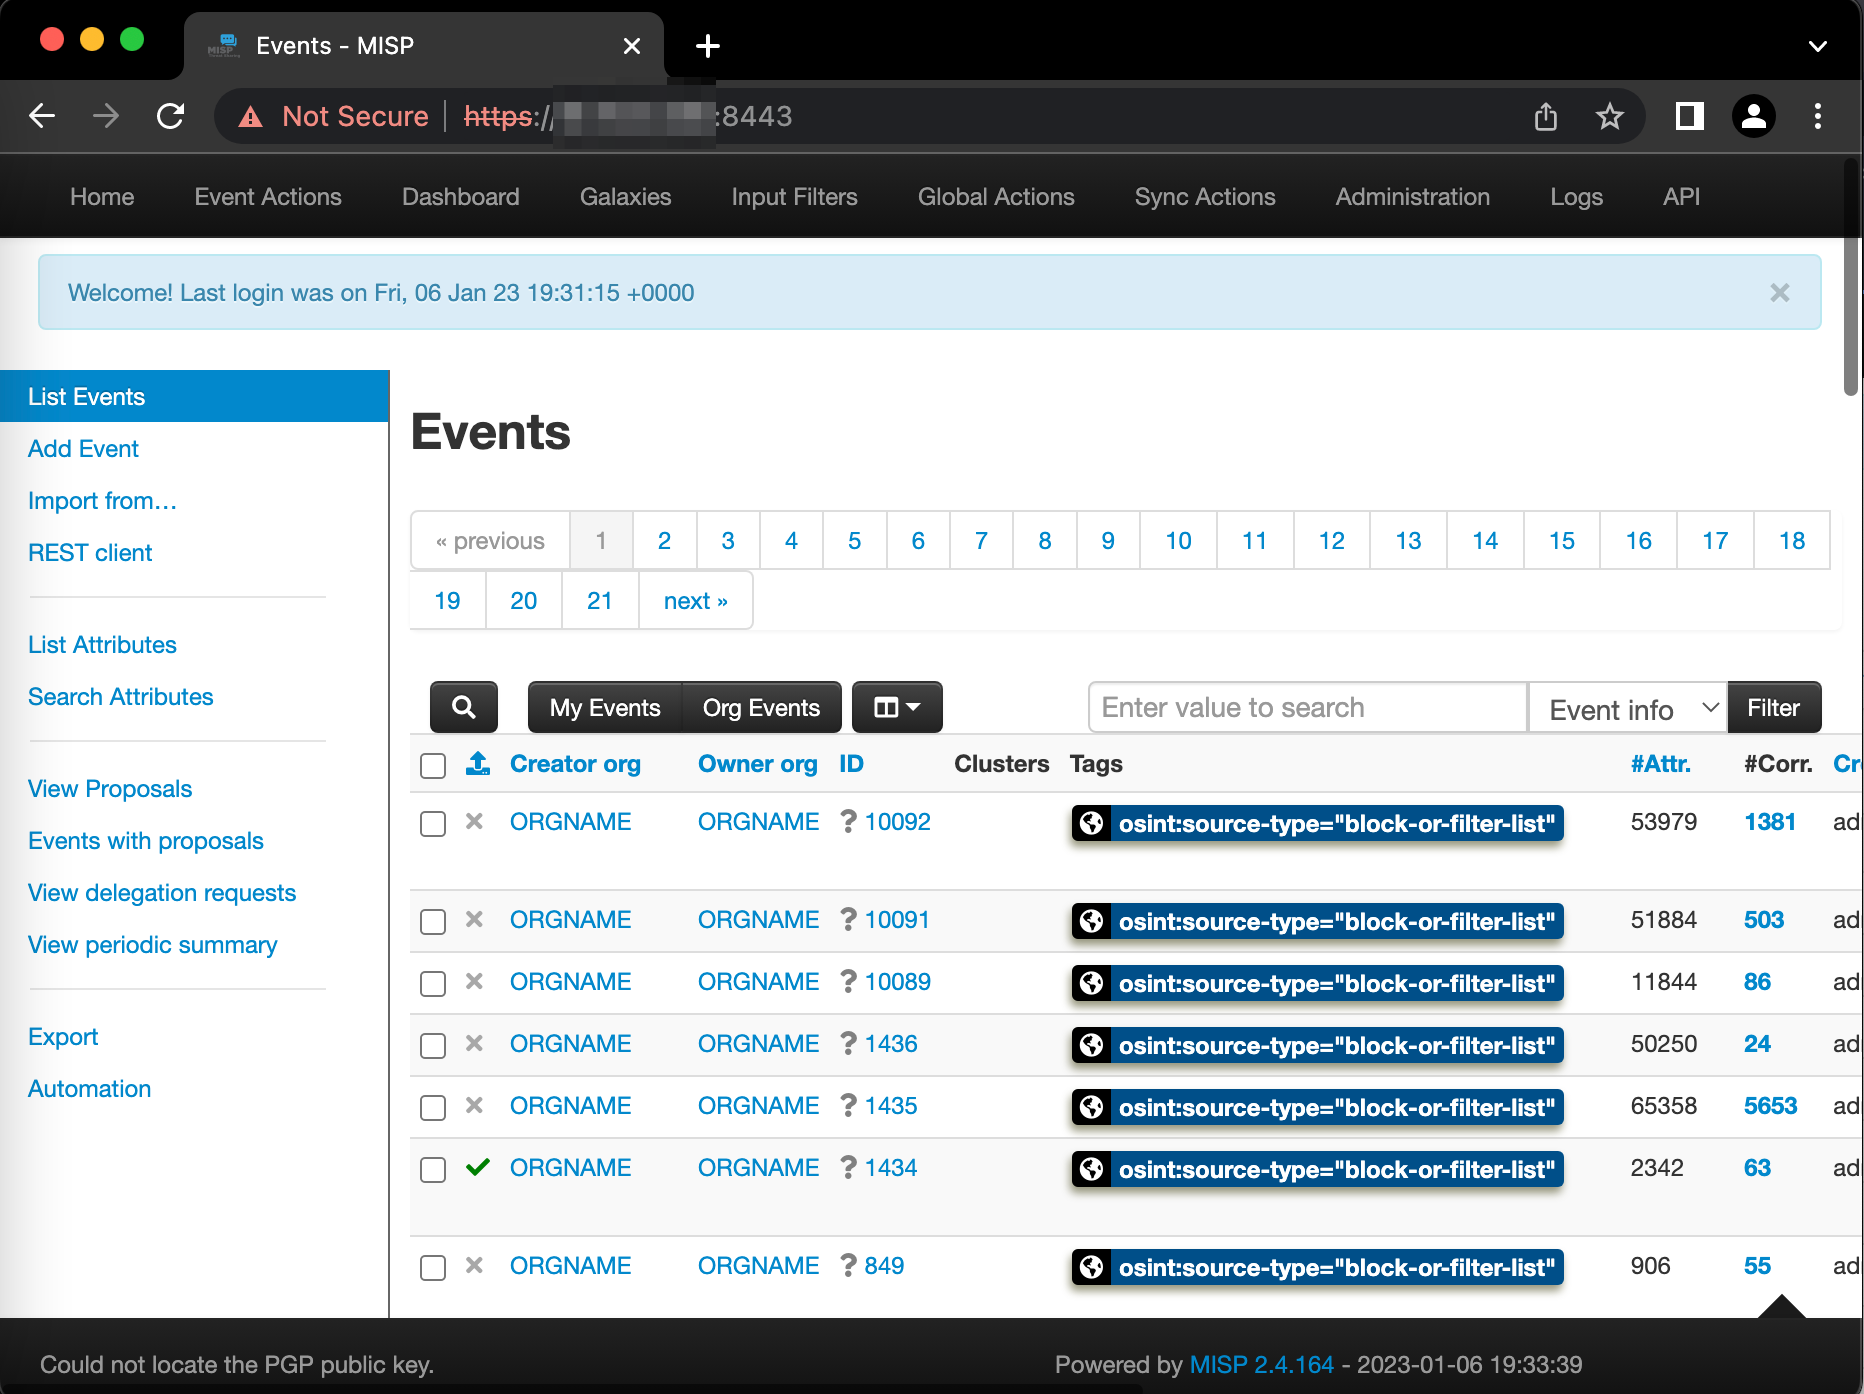
Verify you can acccess MISP. To do this, navigate to the URL you specified in the HOSTNAME environment variable in the misp image from your docker compose above. You should see something similar to below.
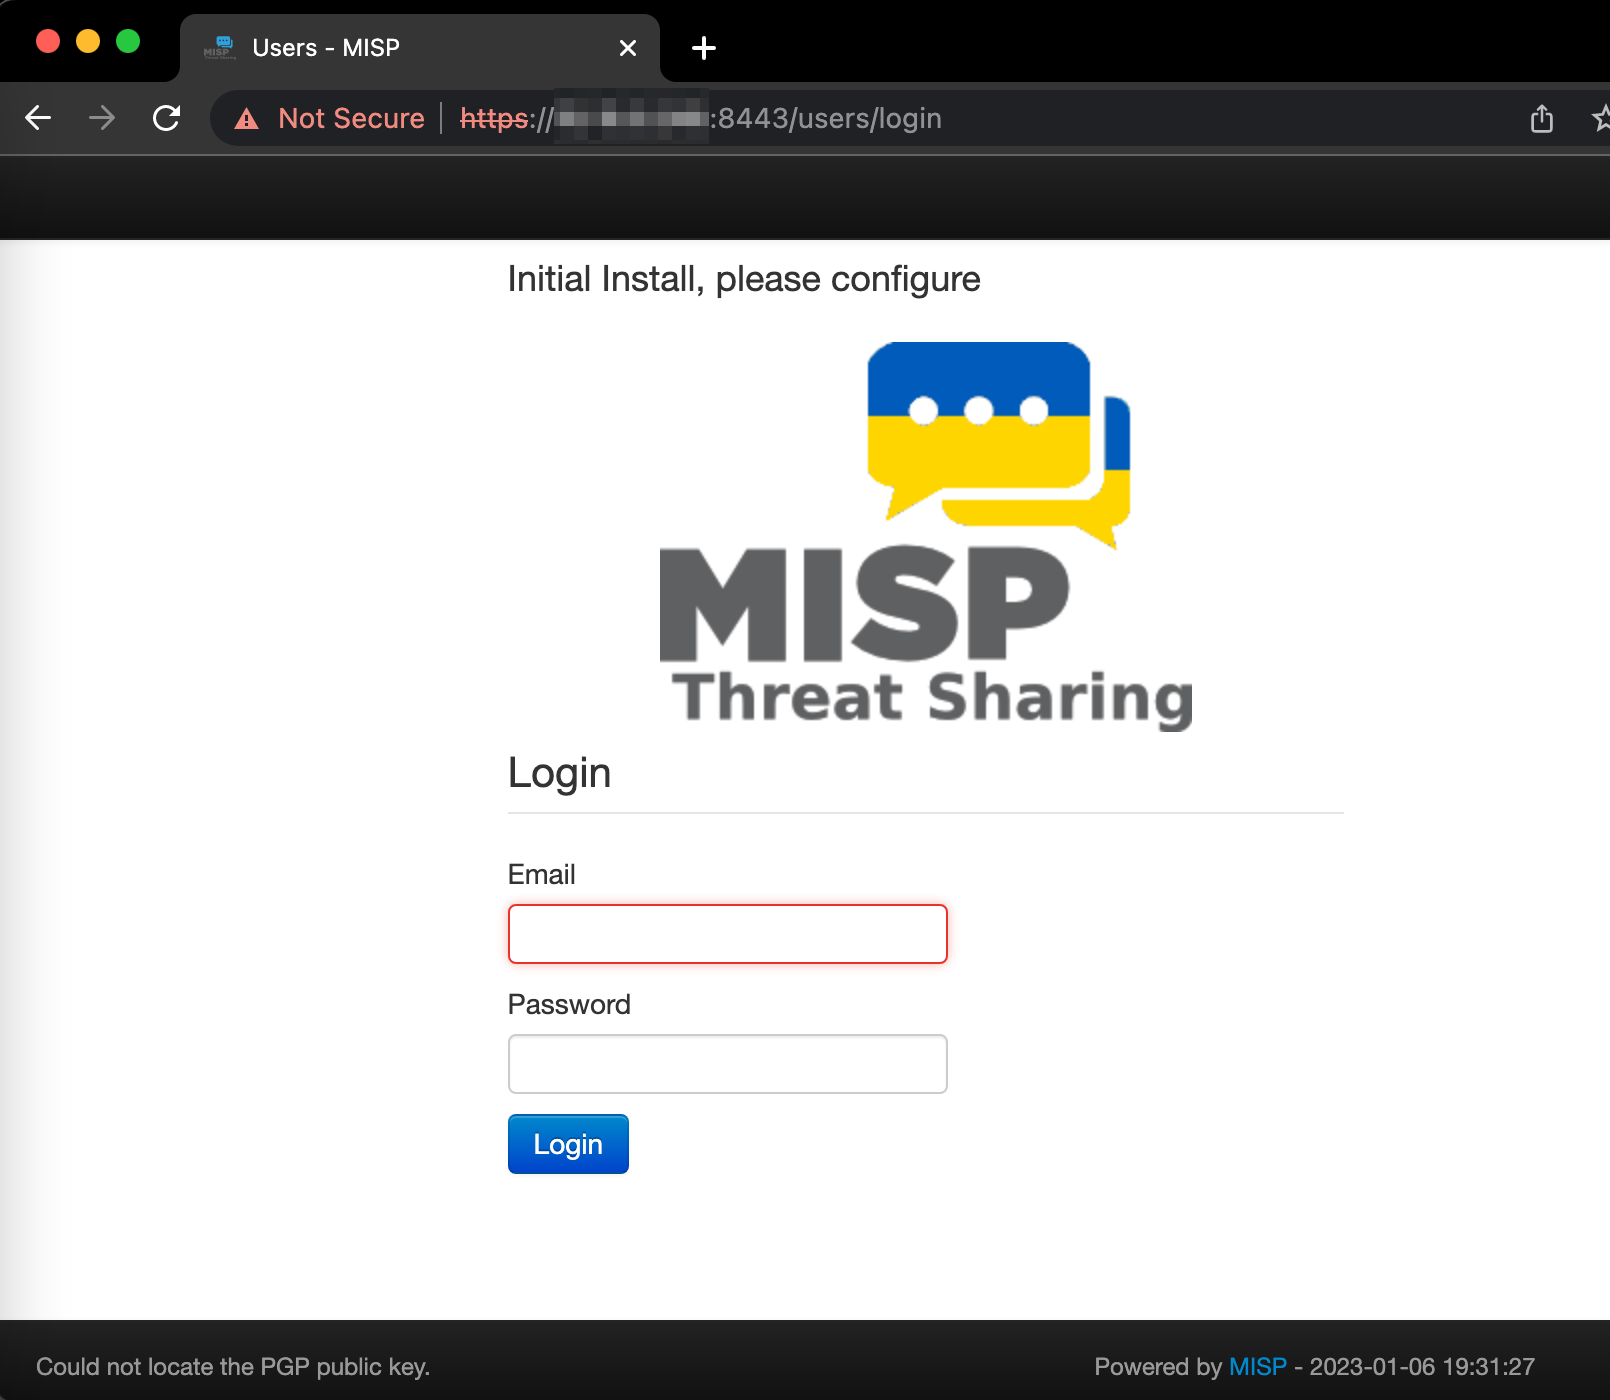
The default username is admin@admin.test and the password is the MISP_ADMIN_PASSPHRASE docker secret we set above.
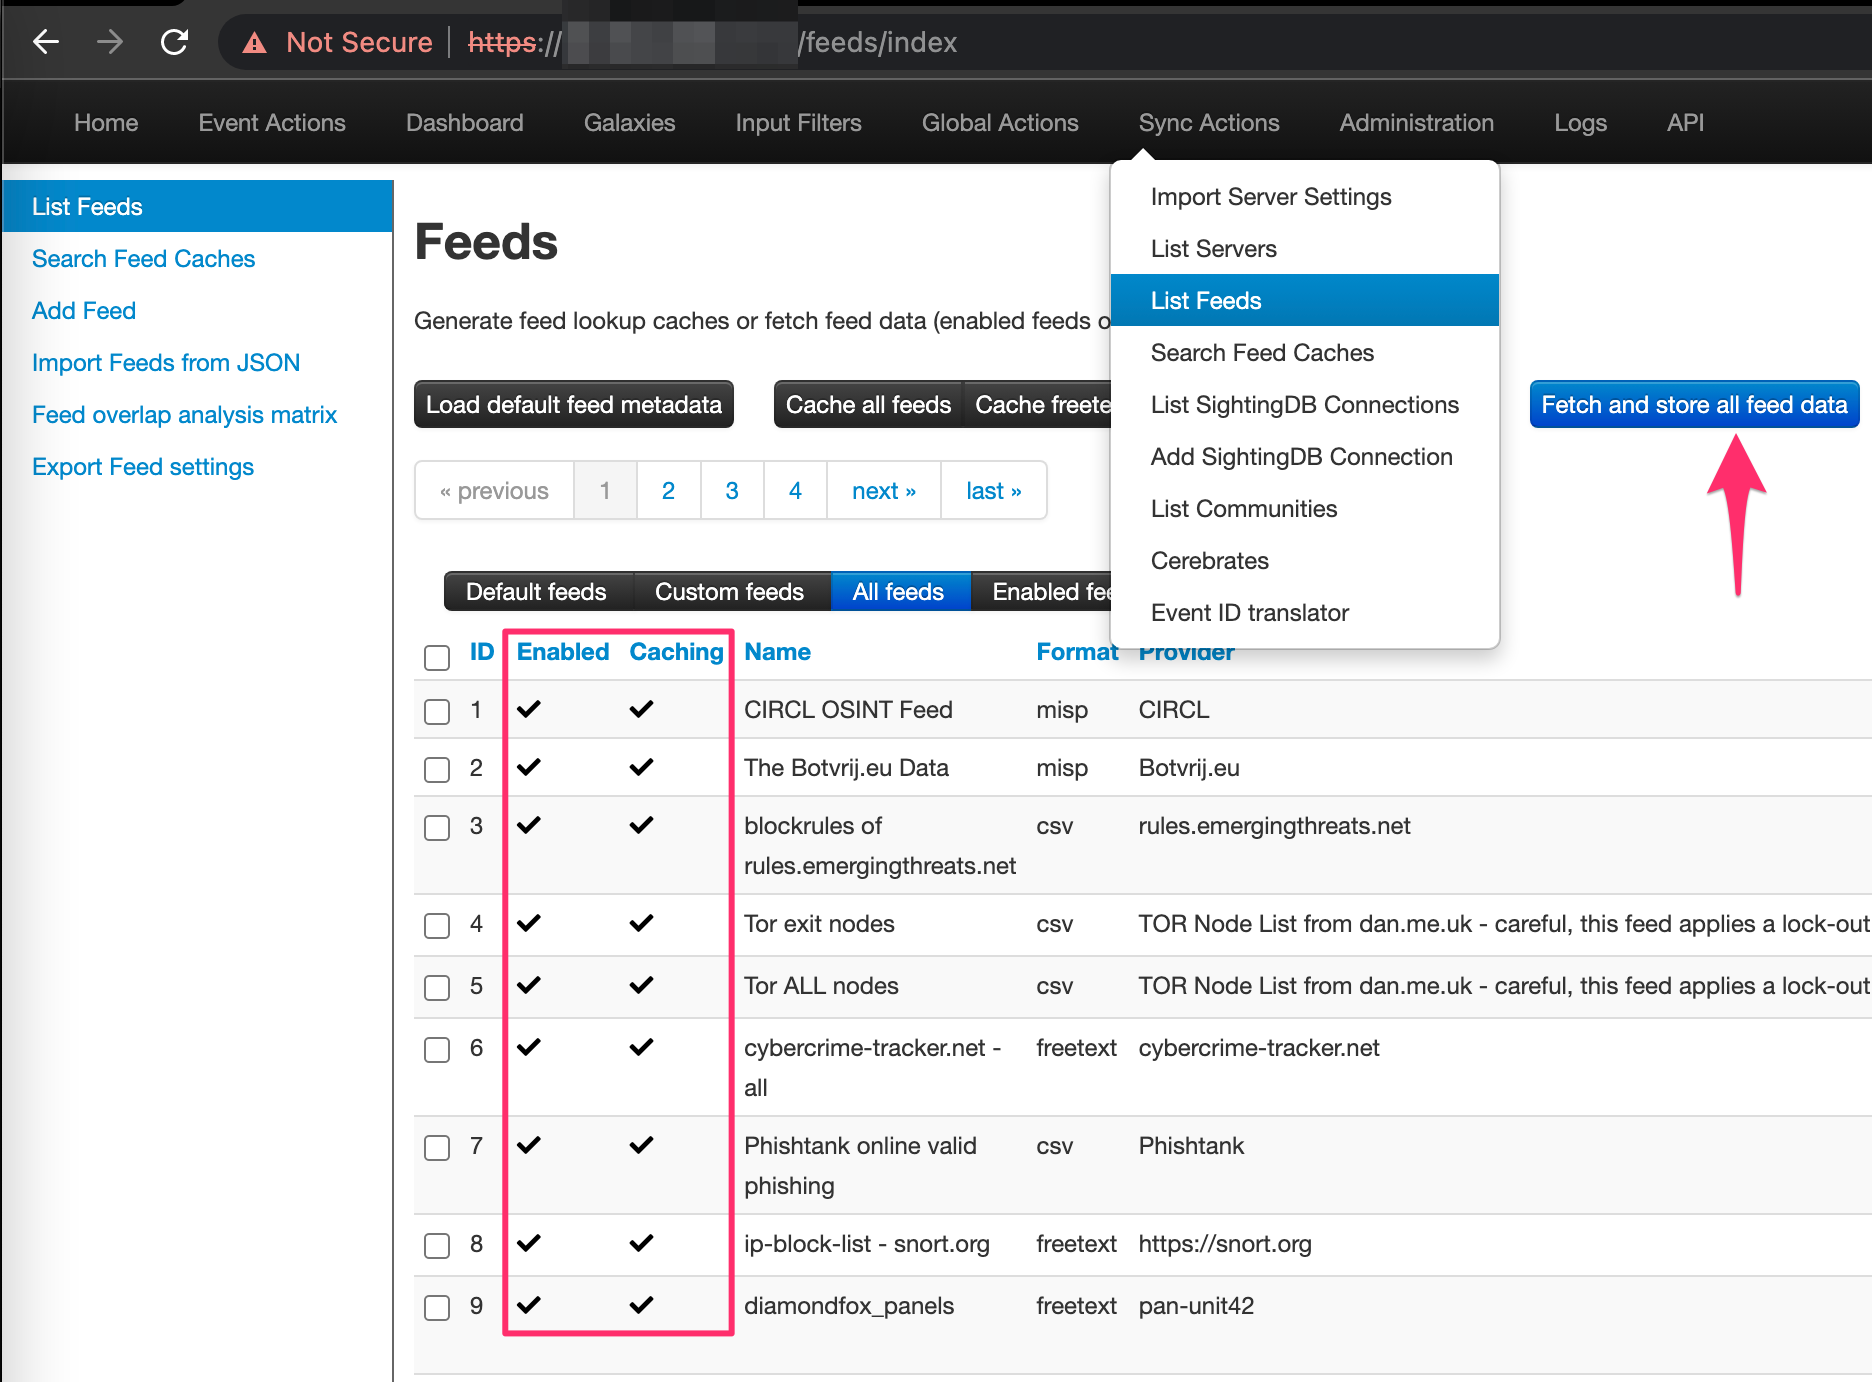
Take into consideration, while we’re using MISP’s default setup, you can add to the default feeds MISP ships with which takes advantage of the true power and expansiveness of the platform. To view the feeds that are installed by default, navigate to Sync Actions --> List Feeds - this is also where you can add feeds. Ensure they are all enabled, caching enabled , and that you’ve fetched / stored all feed data as shown here:
 Note ⚠️ To learn more about default feeds and how to add additional feeds, see this page.
MISP API 🧑💻
The MISP API is powerful and can be used for many things outside what we’ll be using it for with capabilities built in to Graylog. If you’d like to read up on it, check out their docs here.
There are a few handy curl commands to use for troubleshooting and administration for MISP. The following can be used to both test your API key to authenticate to MISP as well as help with carving response using JQ and JSONPath within Graylog:
1
2
3
4
5
curl -X GET --insecure
 --header "Authorization: API_KEY_GOES_HERE" \
 --header "Accept: application/json" \
 --header "Content-Type: application/json" \
 https://MISP_HOSTNAME_OR_IP/attributes/restSearch/value:1.1.1.1 | jq
The following curl command can be used to update the feeds. This can be done initially or you can choose to run it periodically as a scheduled task or cron job if you’d like:
1
2
3
4
5
curl -X POST --insecure \
 --header "Authorization: API_KEY_GOES_HERE" \
 --header "Accept: application/json" \
 --header "Content-Type: application/json" \
 https://MISP_HOSTNAME_OR_IP/feeds/fetchFromAllFeeds
Now that MISP is setup, let’s configure our data adapter and pipeline.
MISP Data Adapter and Pipeline 🔧
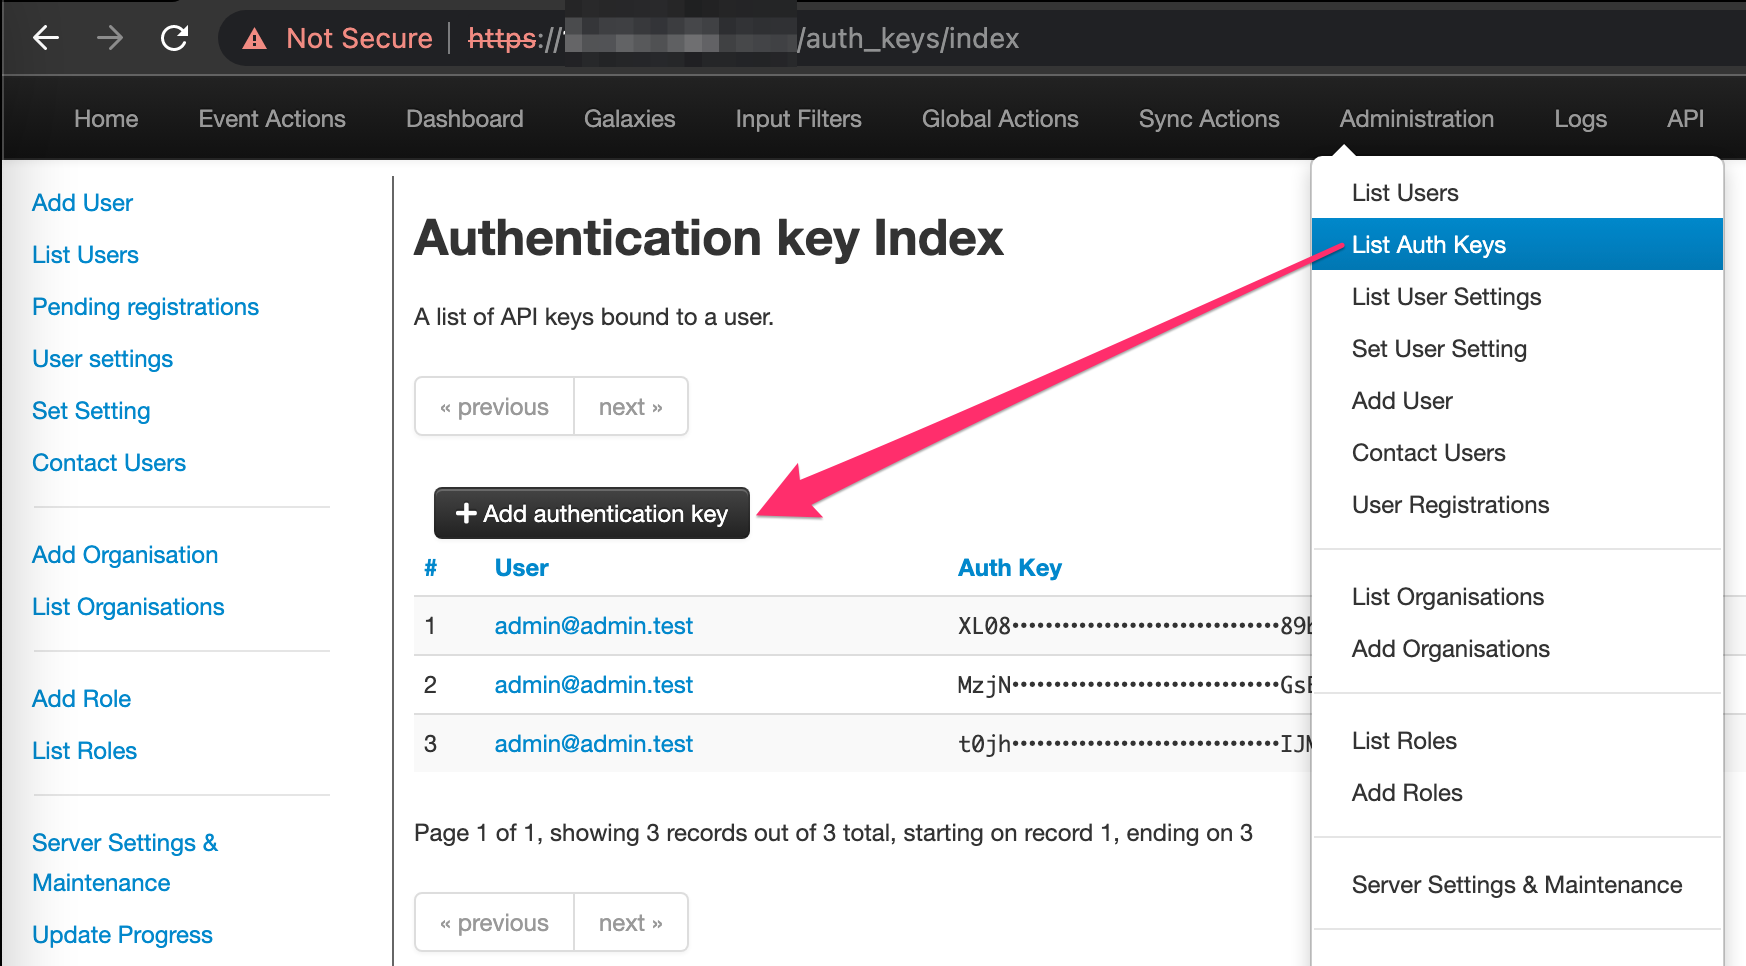
For the next step, we’ll need to login to our MISP instance and create / copy an authentication key so Graylog can interact with the MISP API. Login, click Administration, and click List Auth Keys. Click Add authentication key and copy the key value - careful here, the key will only be listed once and if you don’t save it it will need to be deleted and you’ll need to repeat the process.
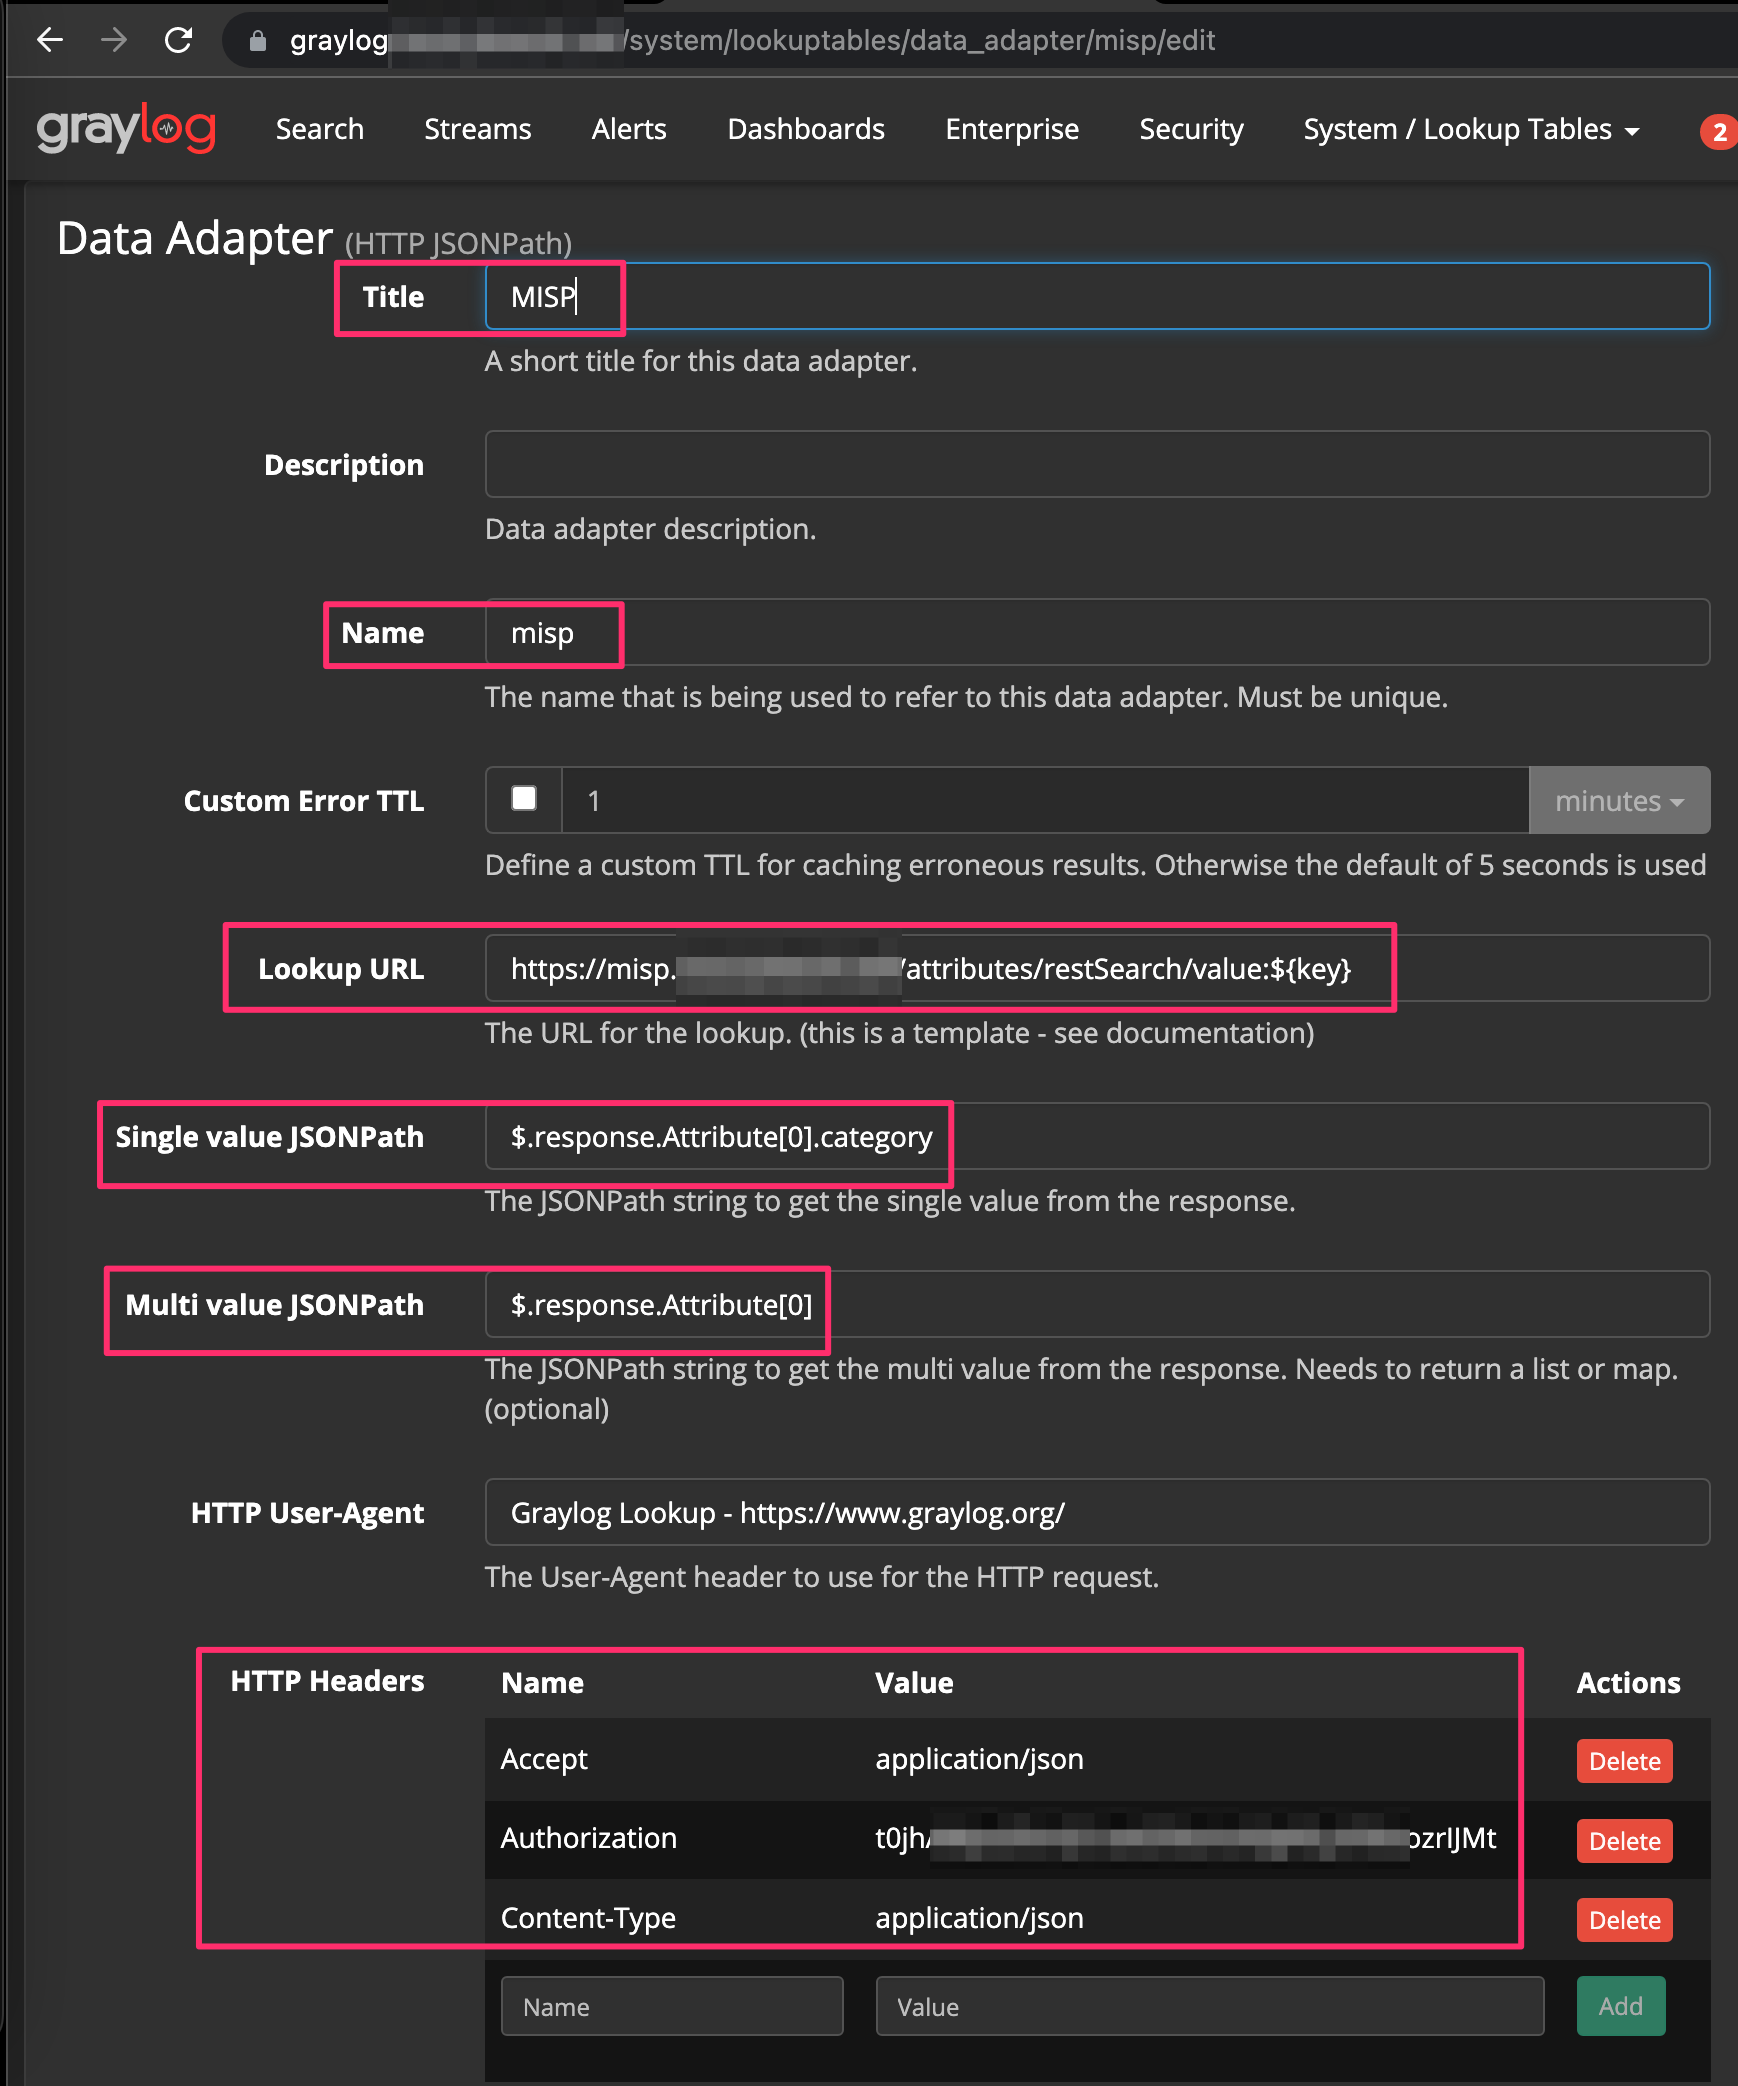
Back in our Graylog instance, click System --> Lookup Tables --> Lookup Tables --> Data Adapters. Fill in the information similar to below, making sure to adjust the URL with your MISP’s instance’s URL and that your Authorization token is appropriately represented in the HTTP headers section.
Once you have your Data Adapter configured, you can test to make sure that you’re successfully authenticating to MISP and that it is in fact returning data.
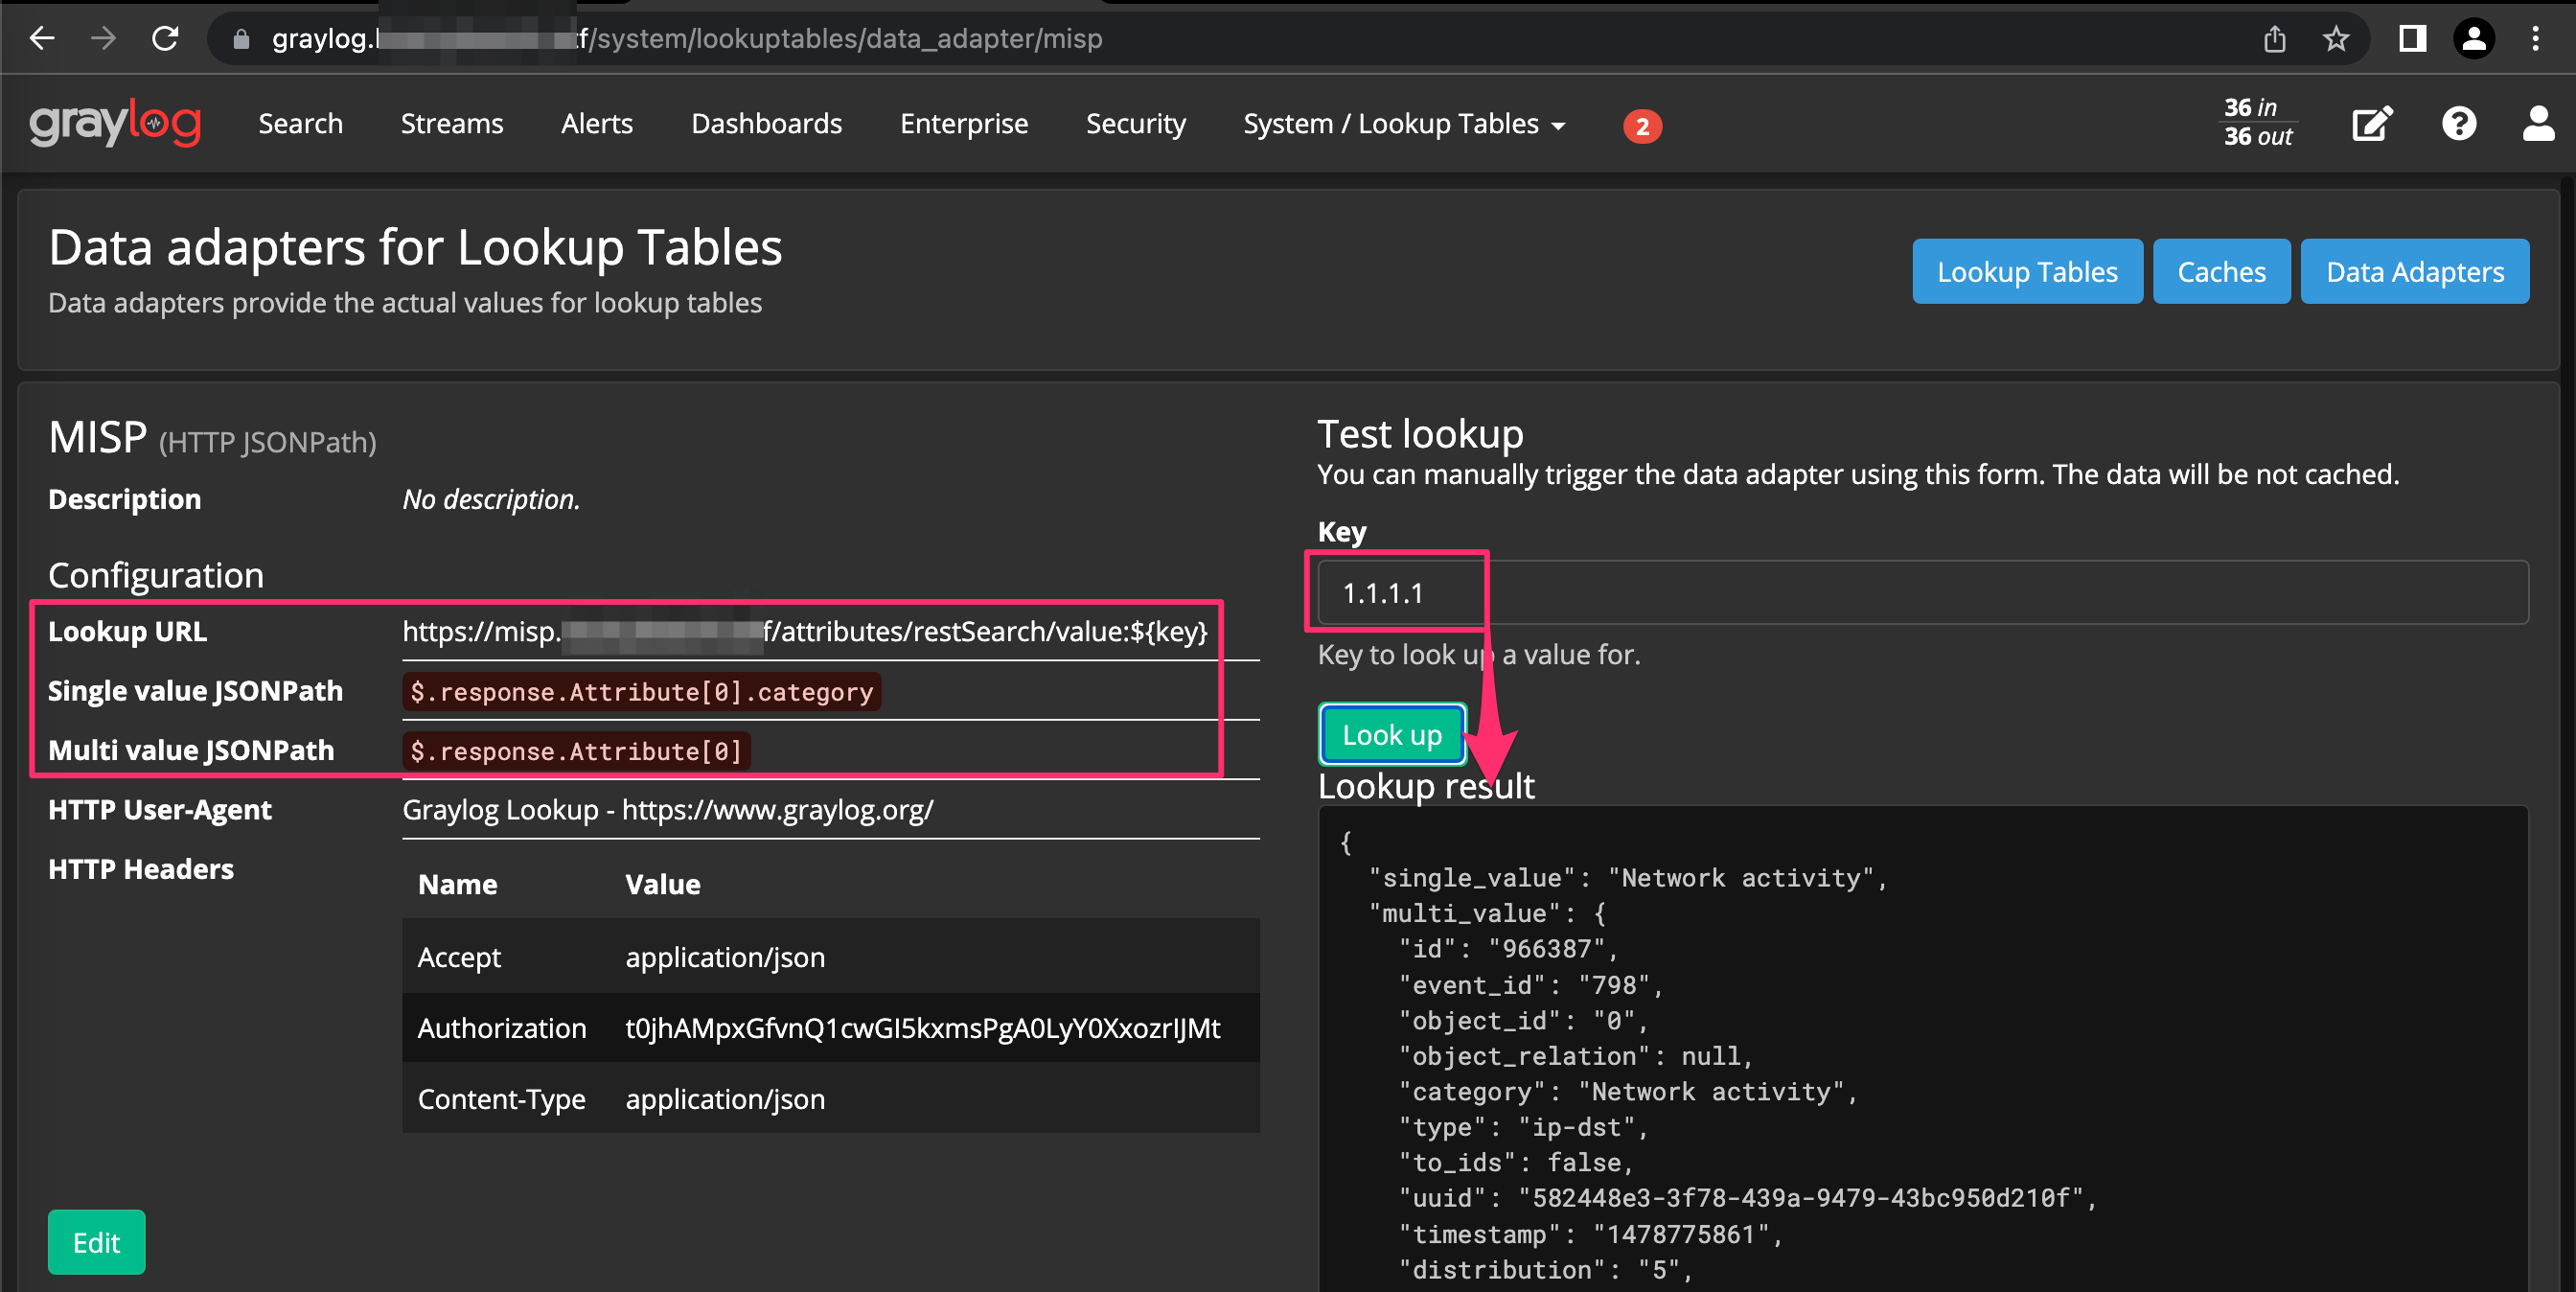
Note ⚠️ Graylog leverages JSONPath functionality where you can specify exactly what you’re interested in returning from the output similar to JQ. Feel free to carve this up however you want but for our example, we’re returning allthethings.
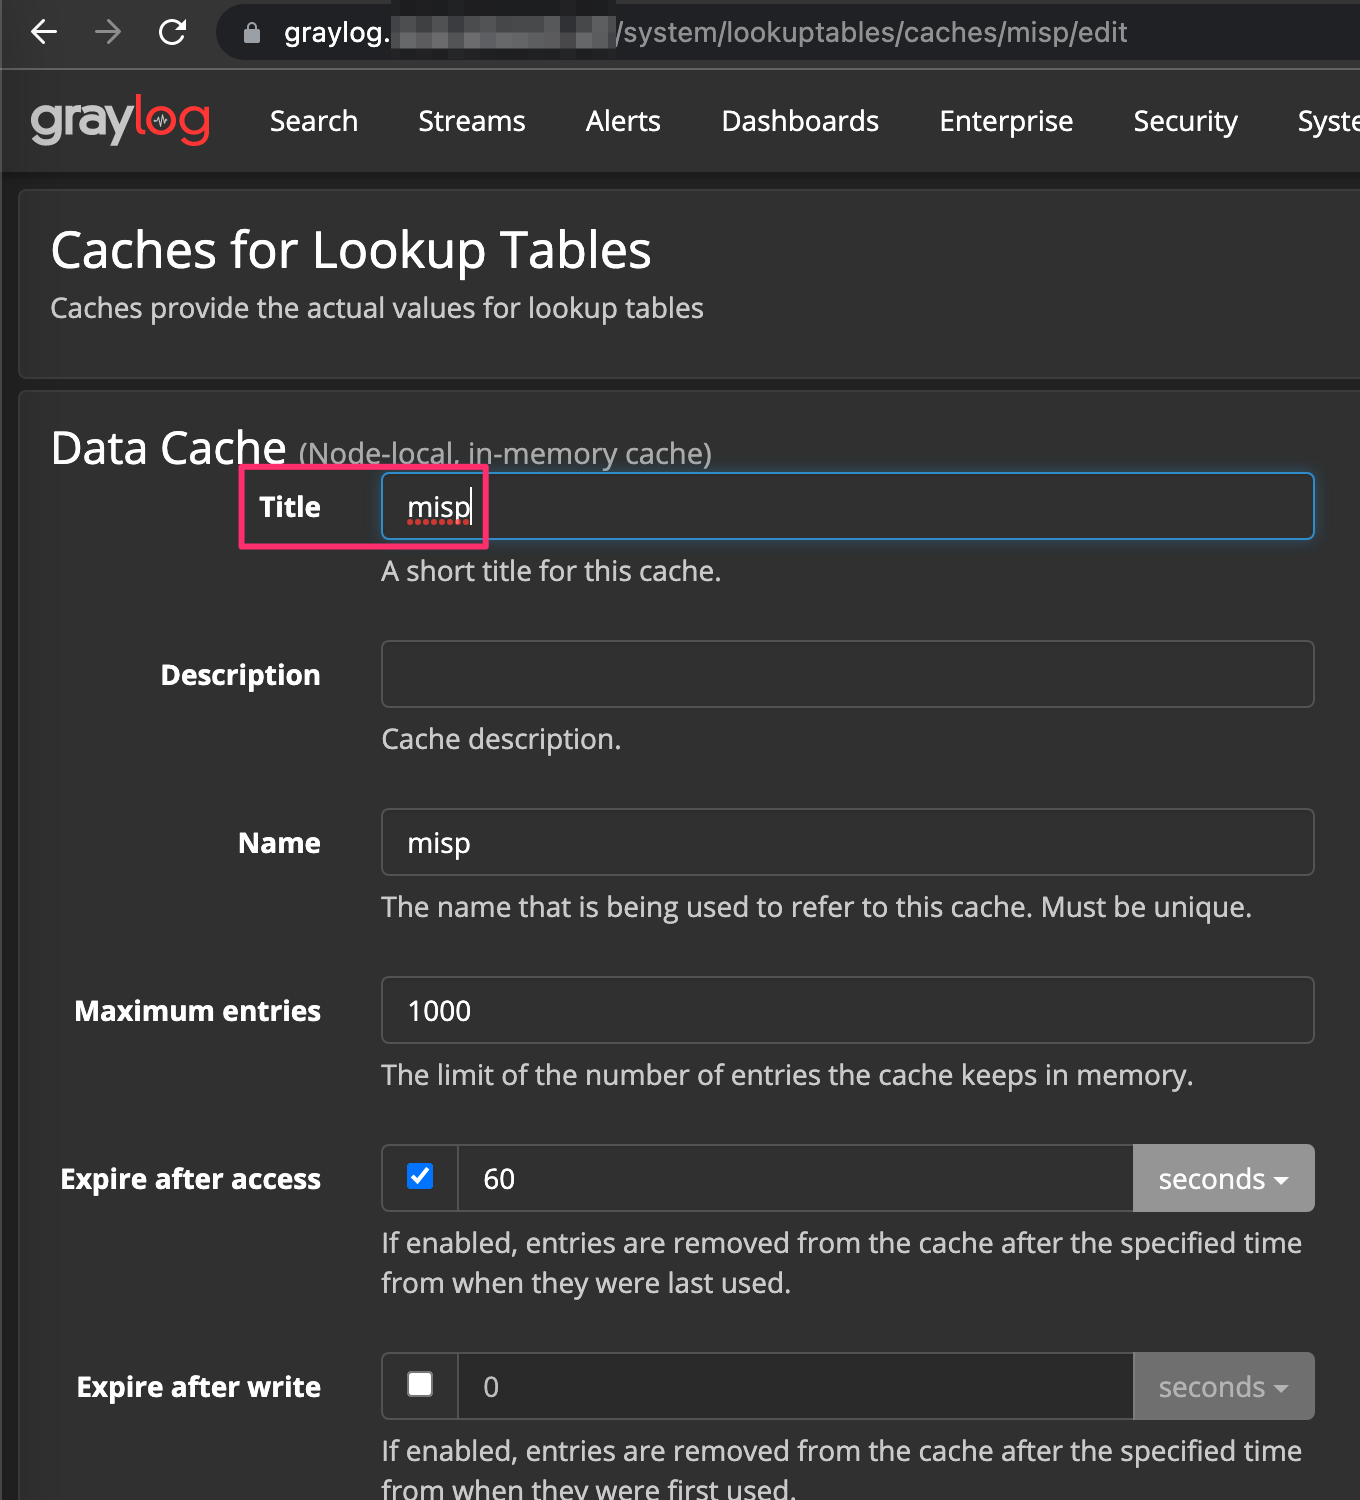
Next, click System --> Lookup Tables --> Lookup Tables --> Caches --> Create Cache. For cache type, select node local in memory cache from the drop down. Give it a name in the title field and leave everything else default.
Click System --> Lookup Tables --> Lookup Tables --> Lookup Tables --> Create Lookup Table and fill in the information below, ensuring the values are in alignment with your naming you’d used previously when setting up the Data Adapter and Cache.
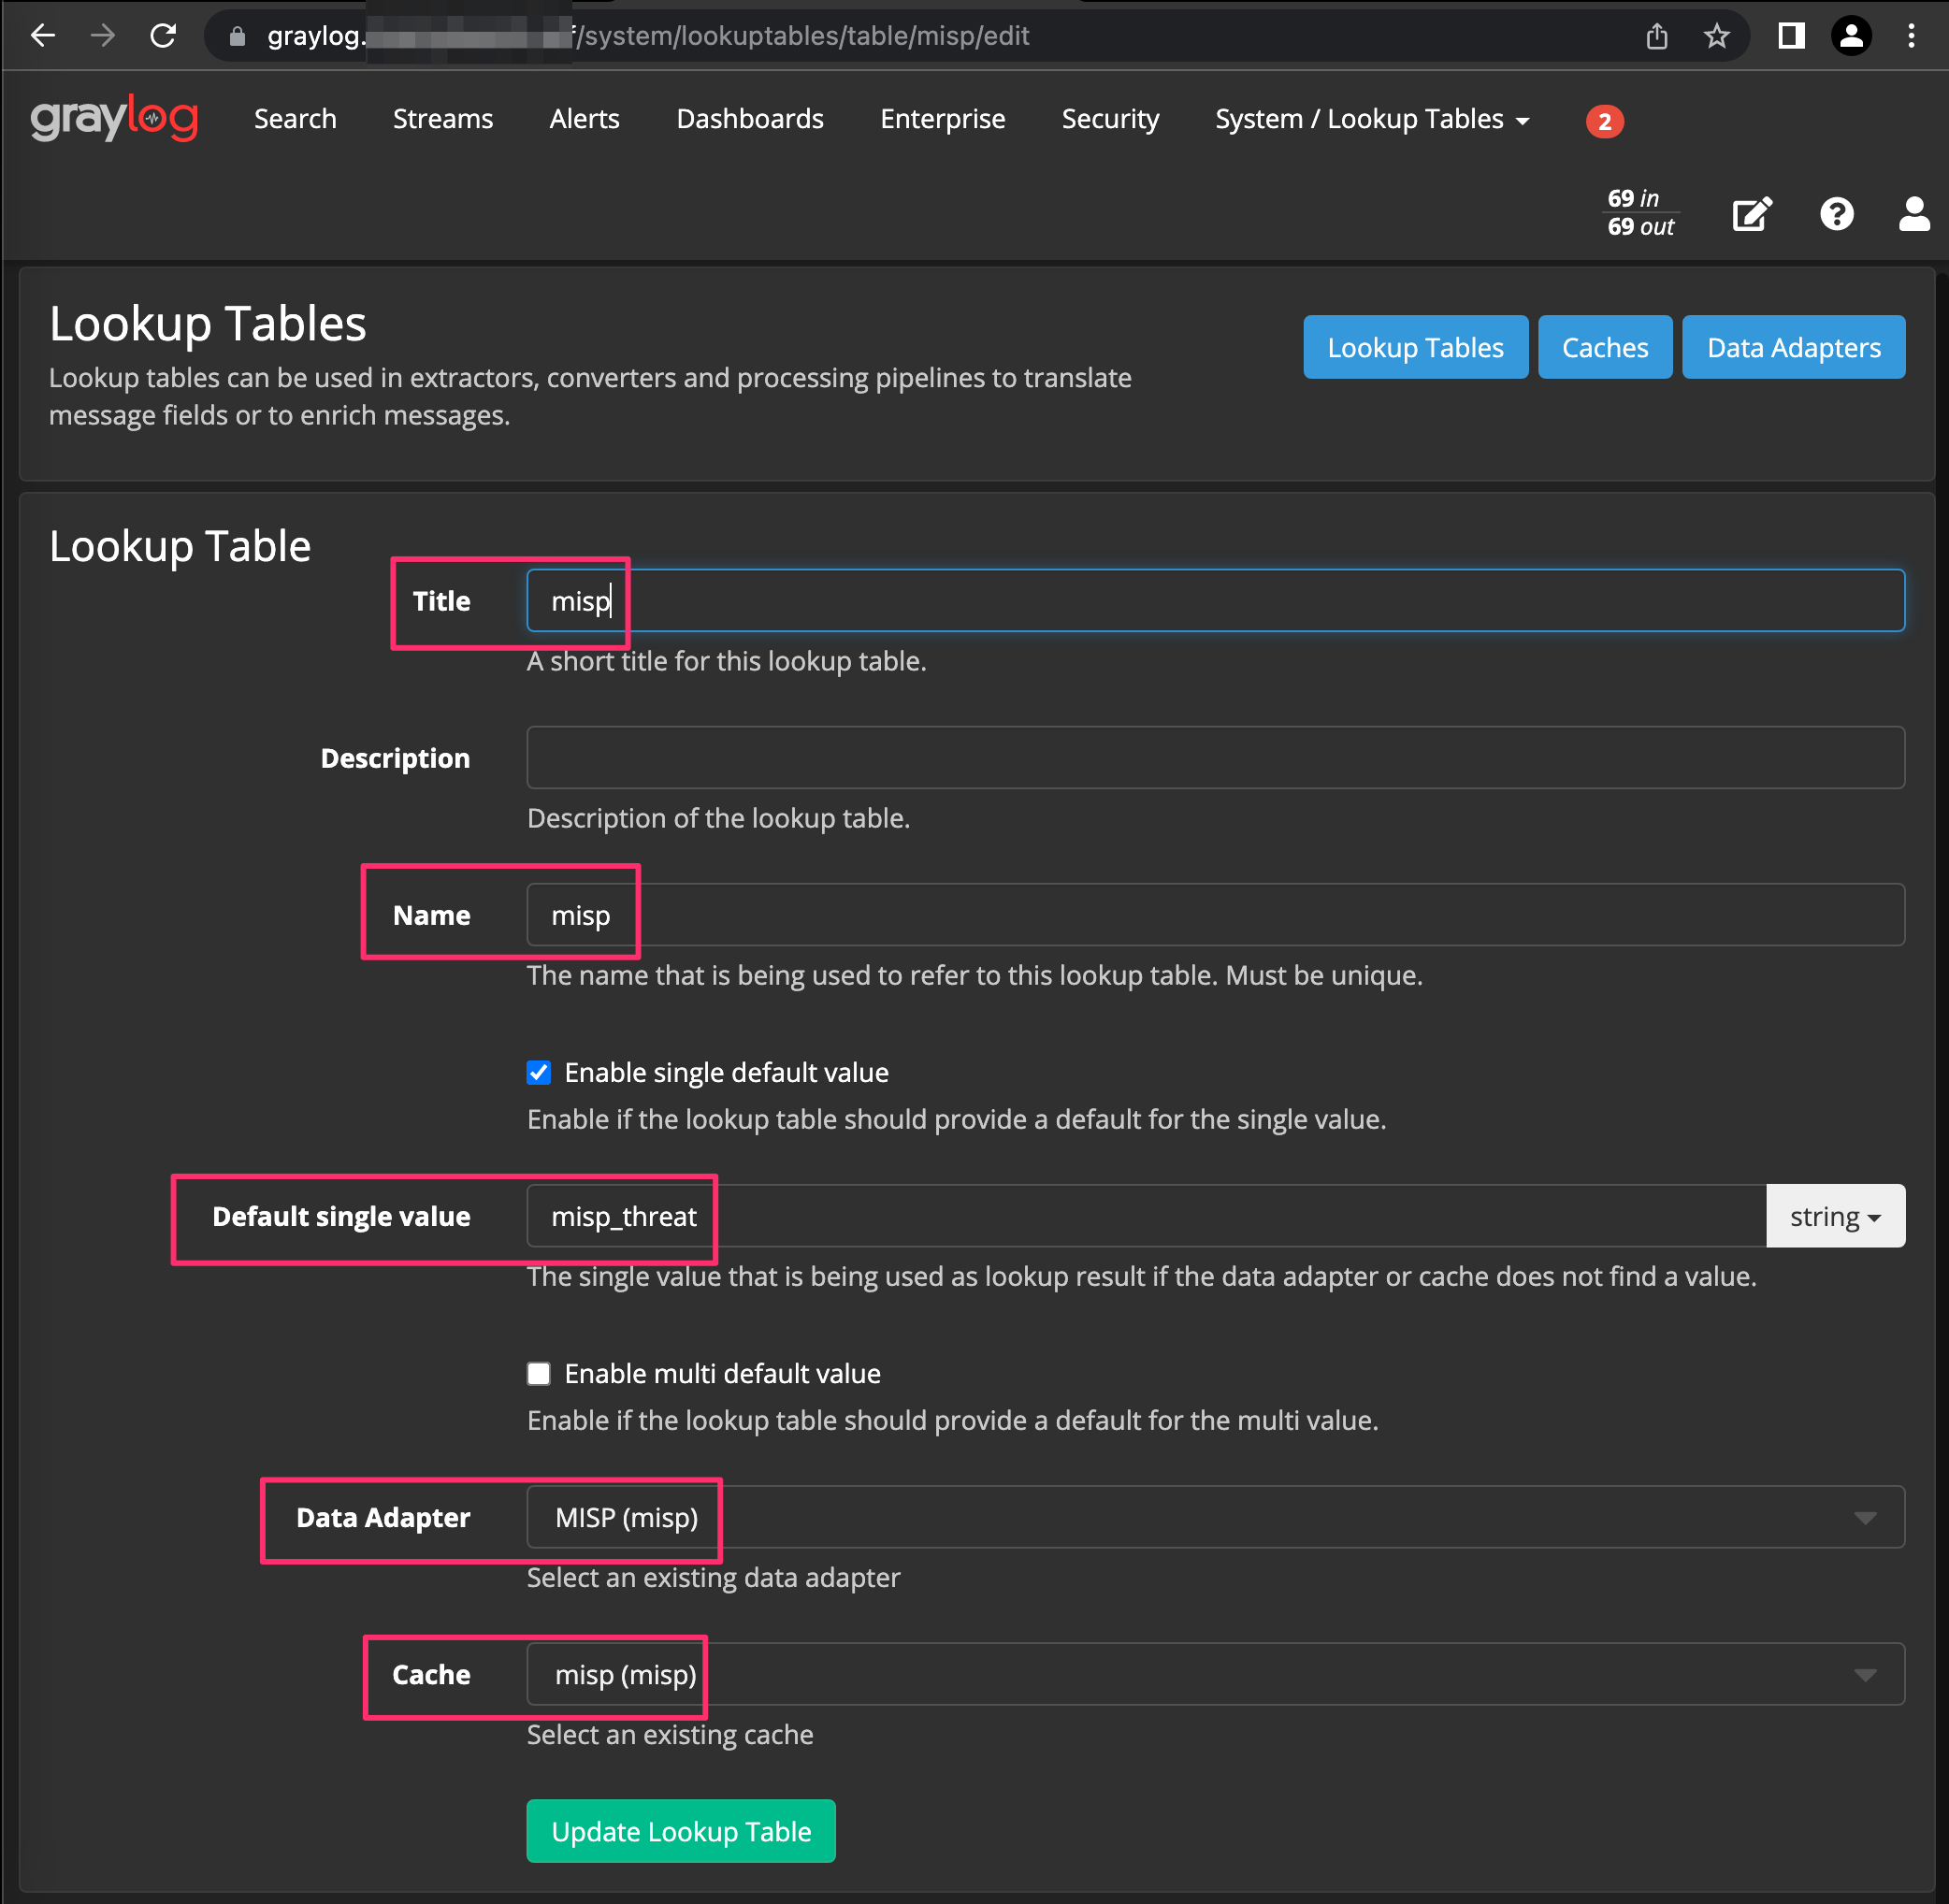
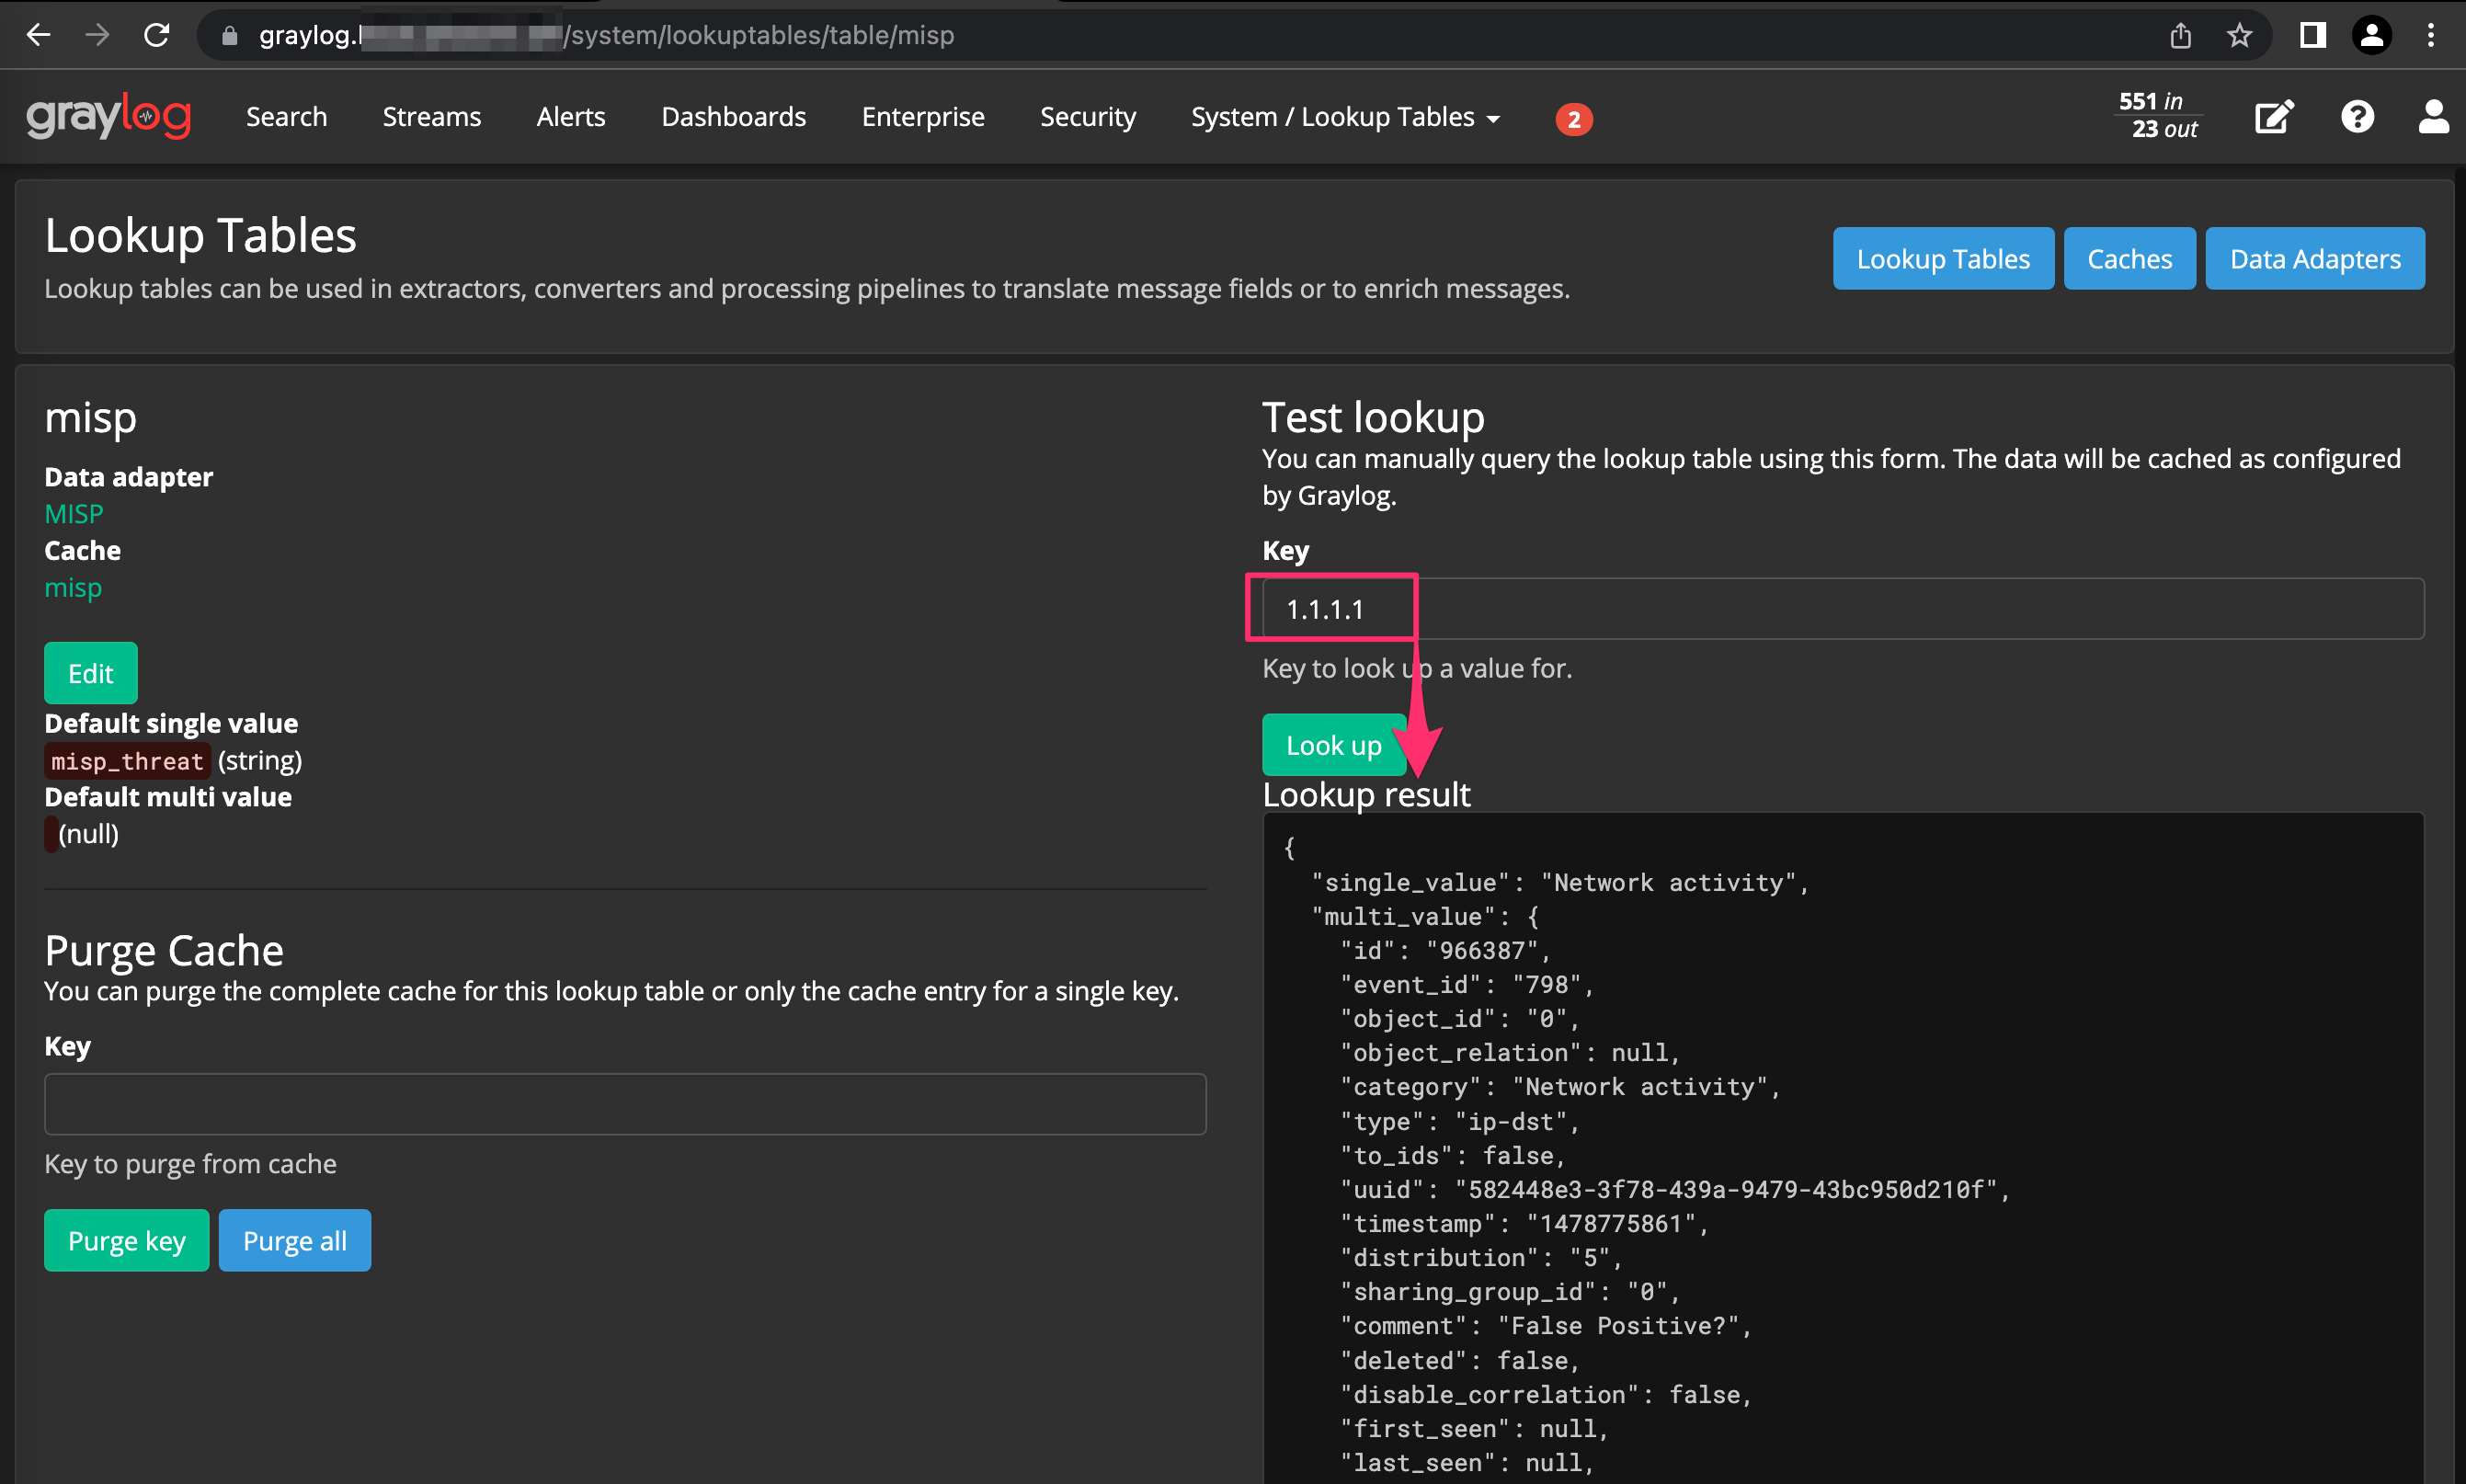
Similar to Data Adapters, Lookup Tables can also be tested by submitting a value and checking that authentication to the MISP API is still successful and that data is retreived.
Next lets setup a pipeline. Click System --> Lookup Tables --> Pipelines --> Manage Rules --> Create Rule. Paste in the following:
1
2
3
4
5
6
7
8
9
10
11
12
13
14
15
16
rule "Enrich - MISP Query"
when
  has_field("domain")
  AND ! to_bool($message.dns_ip_is_internal)
  AND ! has_field("dst_domain_cisco_top1k")

then
    let ldata = lookup(
      lookup_table: "misp",
      key: to_string($message.domain)
      );
    set_fields(
      fields: ldata,
      prefix: "misp_"
      );
end
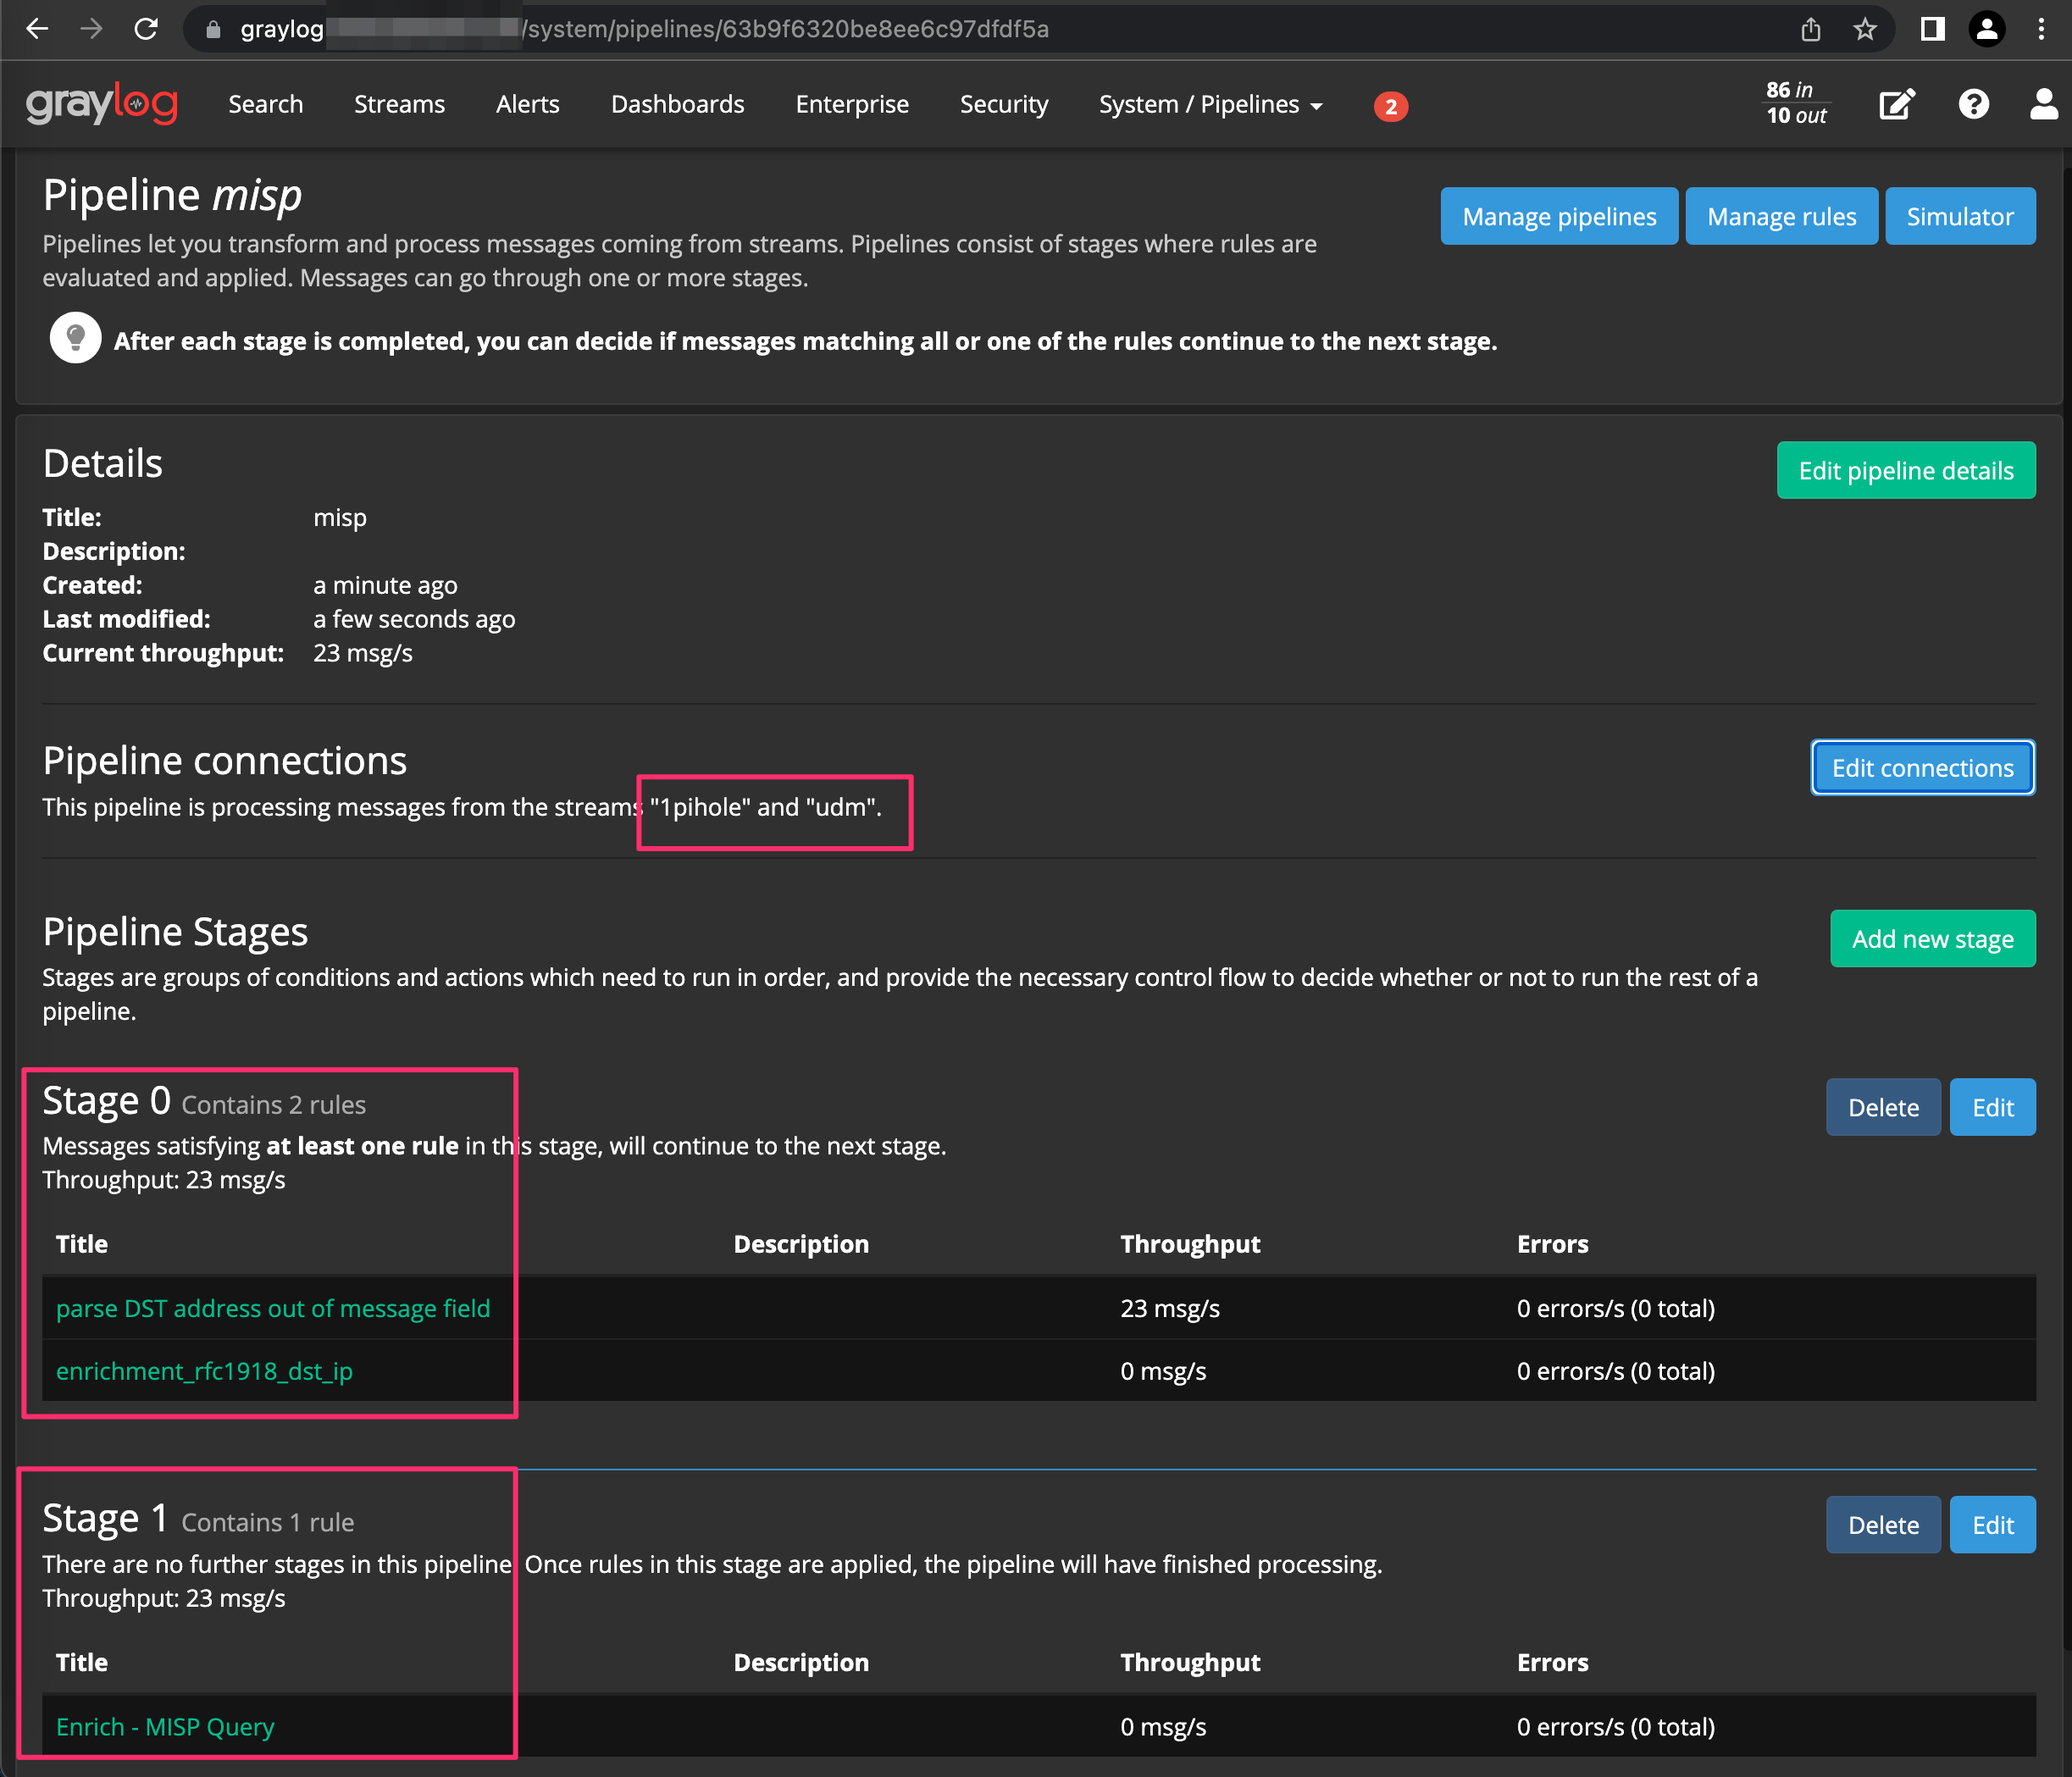
Now click System / Lookup Tables, Pipelines, Add New Pipeline, title it whatever you’d like and save. Click Edit for Stage 0 and add parse DST address out of message field and enrichment rfc1918 dst_ip rules we created earlier. Add another Stage and select “Enrich - MISP Query” from the drop down. Click Edit connections and choose the stream you’d like to add. For our example, we’ll select Pi-Hole and udm as sources.
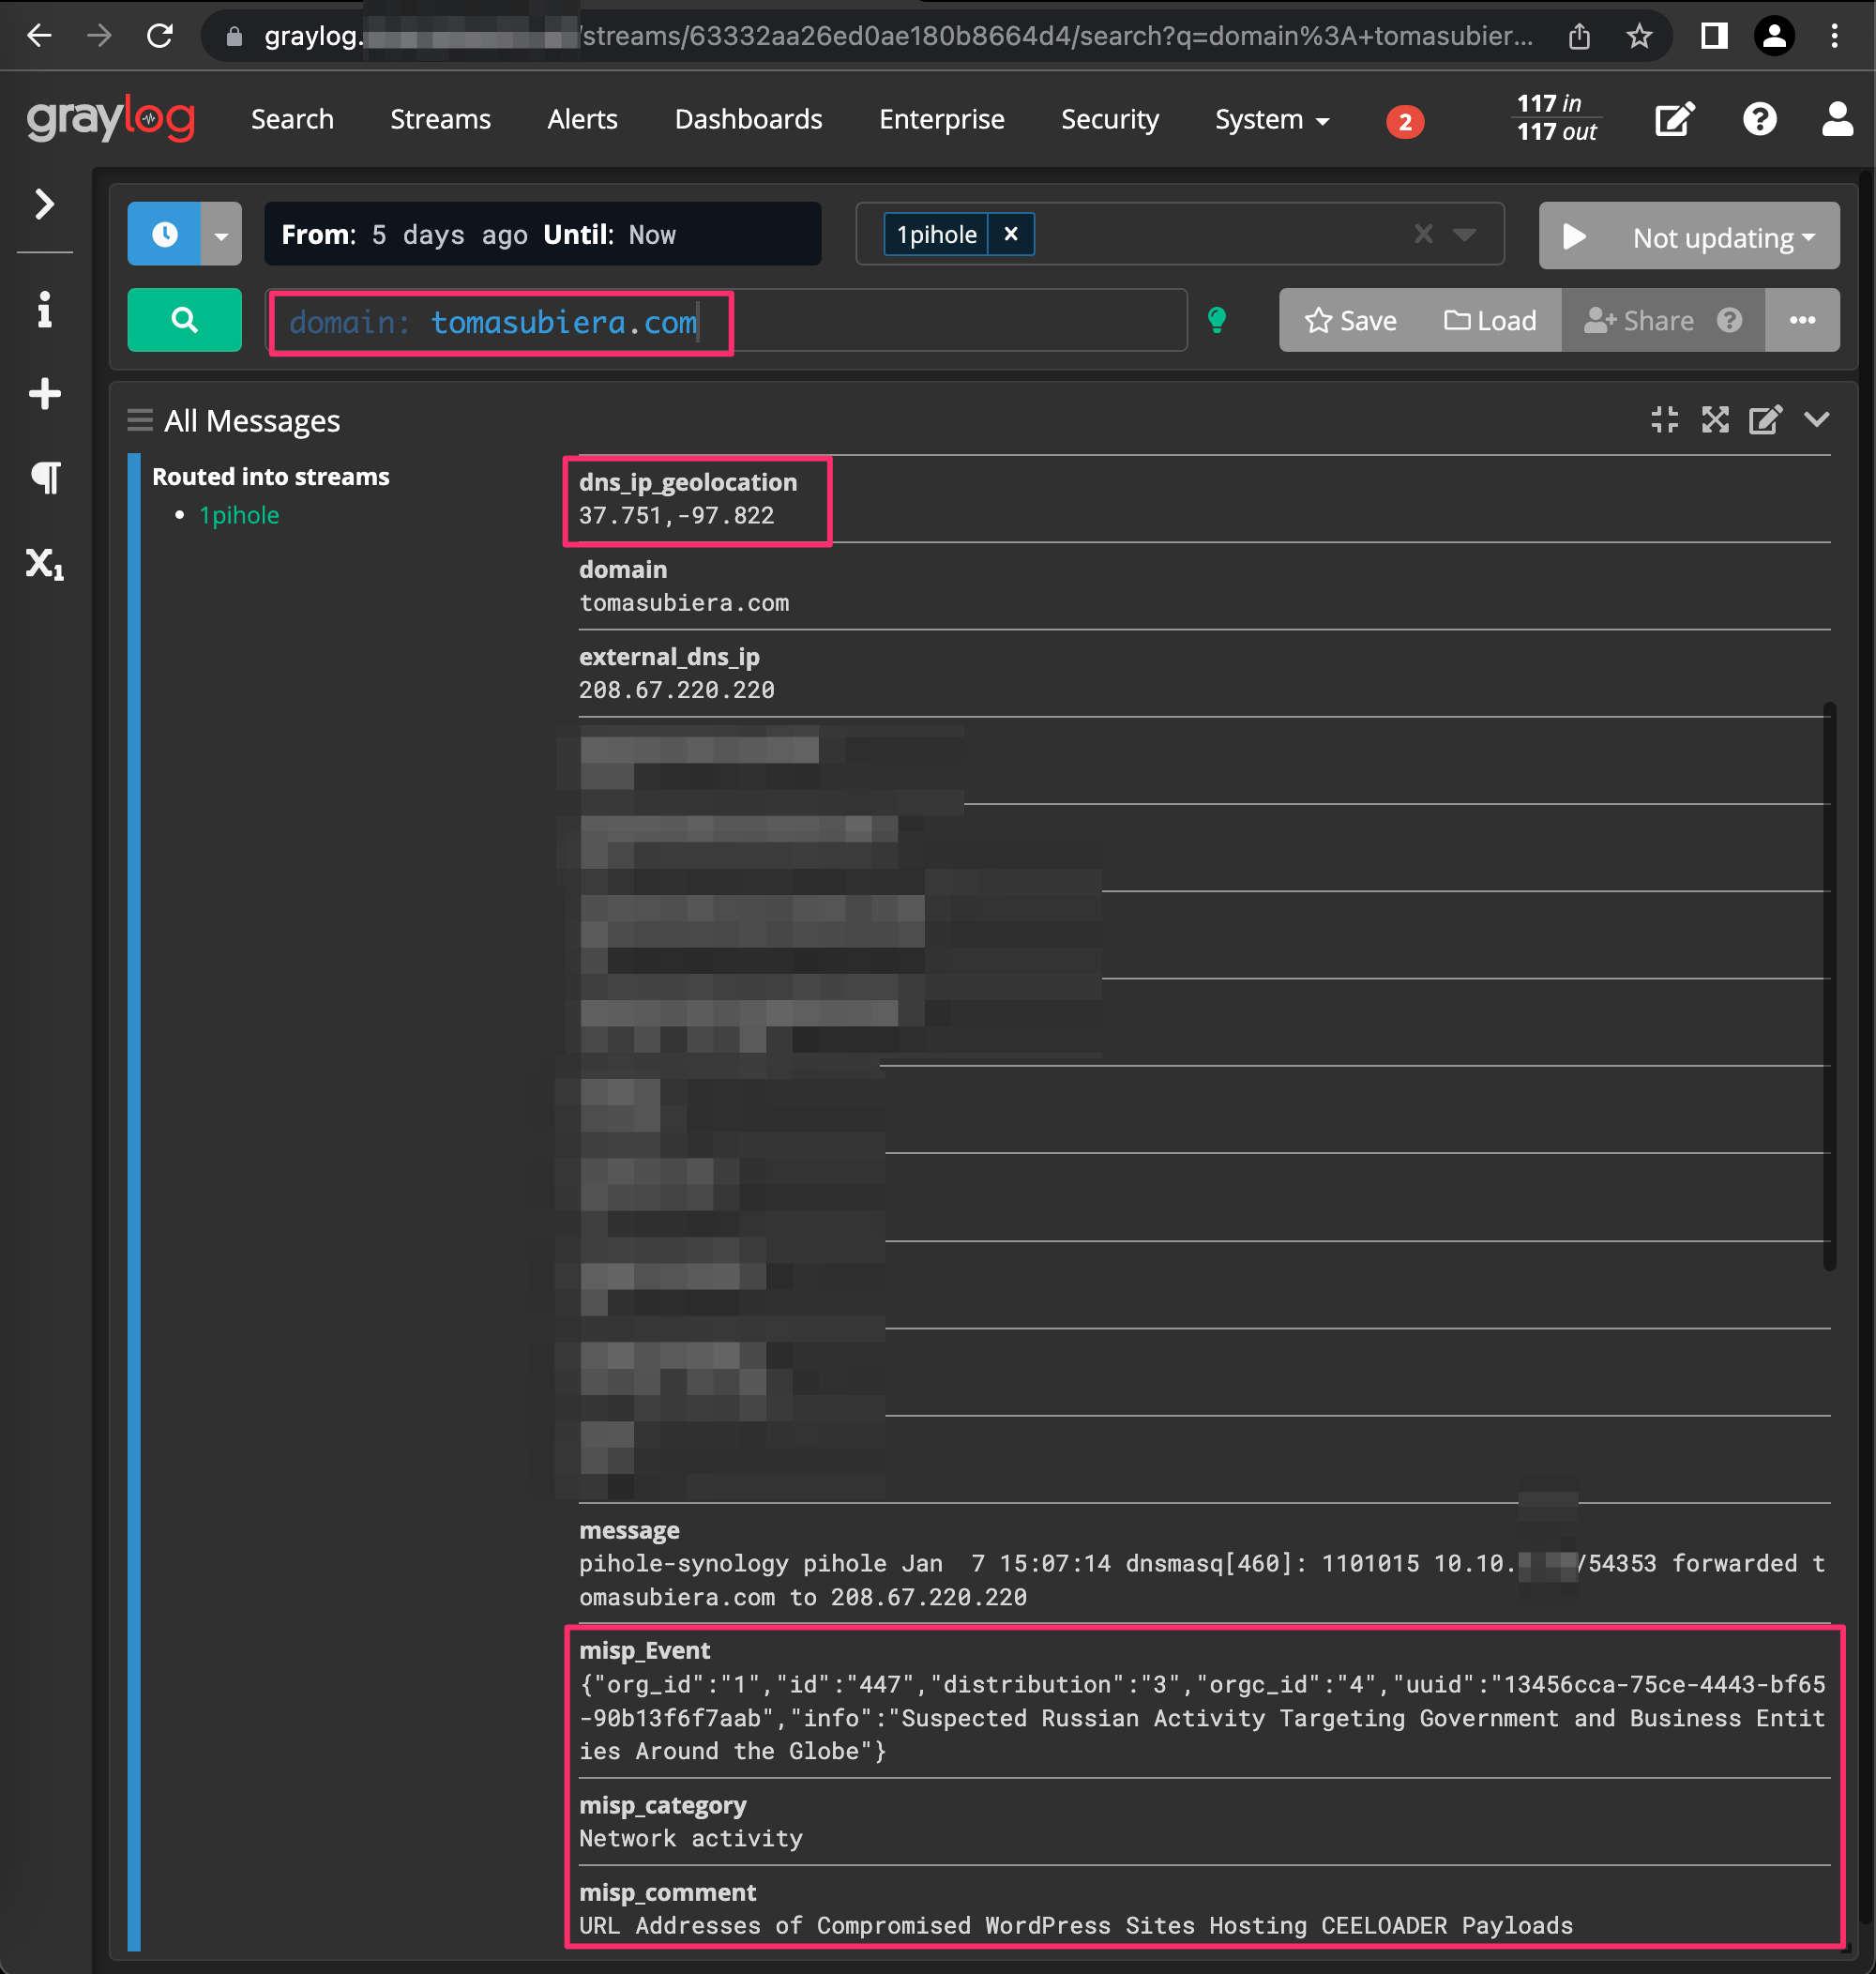
Lets navigate back to our Pi-Hole stream to see the enriched log data fields. Sorry in advance for all the blurries, trying to redact irrelevant data that I was too lazy to remove when debugging.
Alienvault OTX
Similar to MISP, Alienvault OTX is a threat intelligence feed that can be used for domain lookups, IP address lookups, and much more. However, Alienvault hosts this feed and lookups are made against their API vs our locally hosted MISP api.
While it is a free service, you are limited by Alienvault to how many API requests you can make per day. To top that off, Graylog does not gracefully handle API threshold exceptions unless you explicitly configure it (e.g., drop request if API doesn’t respond in x milliseconds). If you don’t properly take this in to account, you will find your instance grinding to a hault with filled process and output buffers.
For some ideas on how you can configure OTX and potentially other threat intel feed lookups, check out this write up here.
A Note on False Positives 📝
With the current setup, you will get lots of false positives. A major part of managing this system will be minimizing the amount of false positives and false negatives. For false positives, an allow list can be leveraged to weed out common false positive IP addresses or domain names in your environment. This is somewhat similar to the Cisco Umbrella Top 1000 list for tagging syslog messages you are uninterested in processing within your pipelines.
This will involve creating a seperate lookup table and add as a pipeline which you will maintain over time as you tune your system. As you see false positives, update the list, lower your false positives.
Dashboards 📊
The moment we’ve been waiting for, pretty dashboards to deliver to our bosses (wives or fur babies) to show off all our hard work!
Jokes aside, an effective dashboard:
- Gives a quick glimpse over large amounts of data
- Enable drilling down in to actionable details for investigations or research
- Provide an interactive capability that can be dynamically manipulated depending on what you’re trying to accomplish
I’ve created the following Dashboard for this blog to demonstrate some sort of usefulness of this data to hopefully tie this all together.
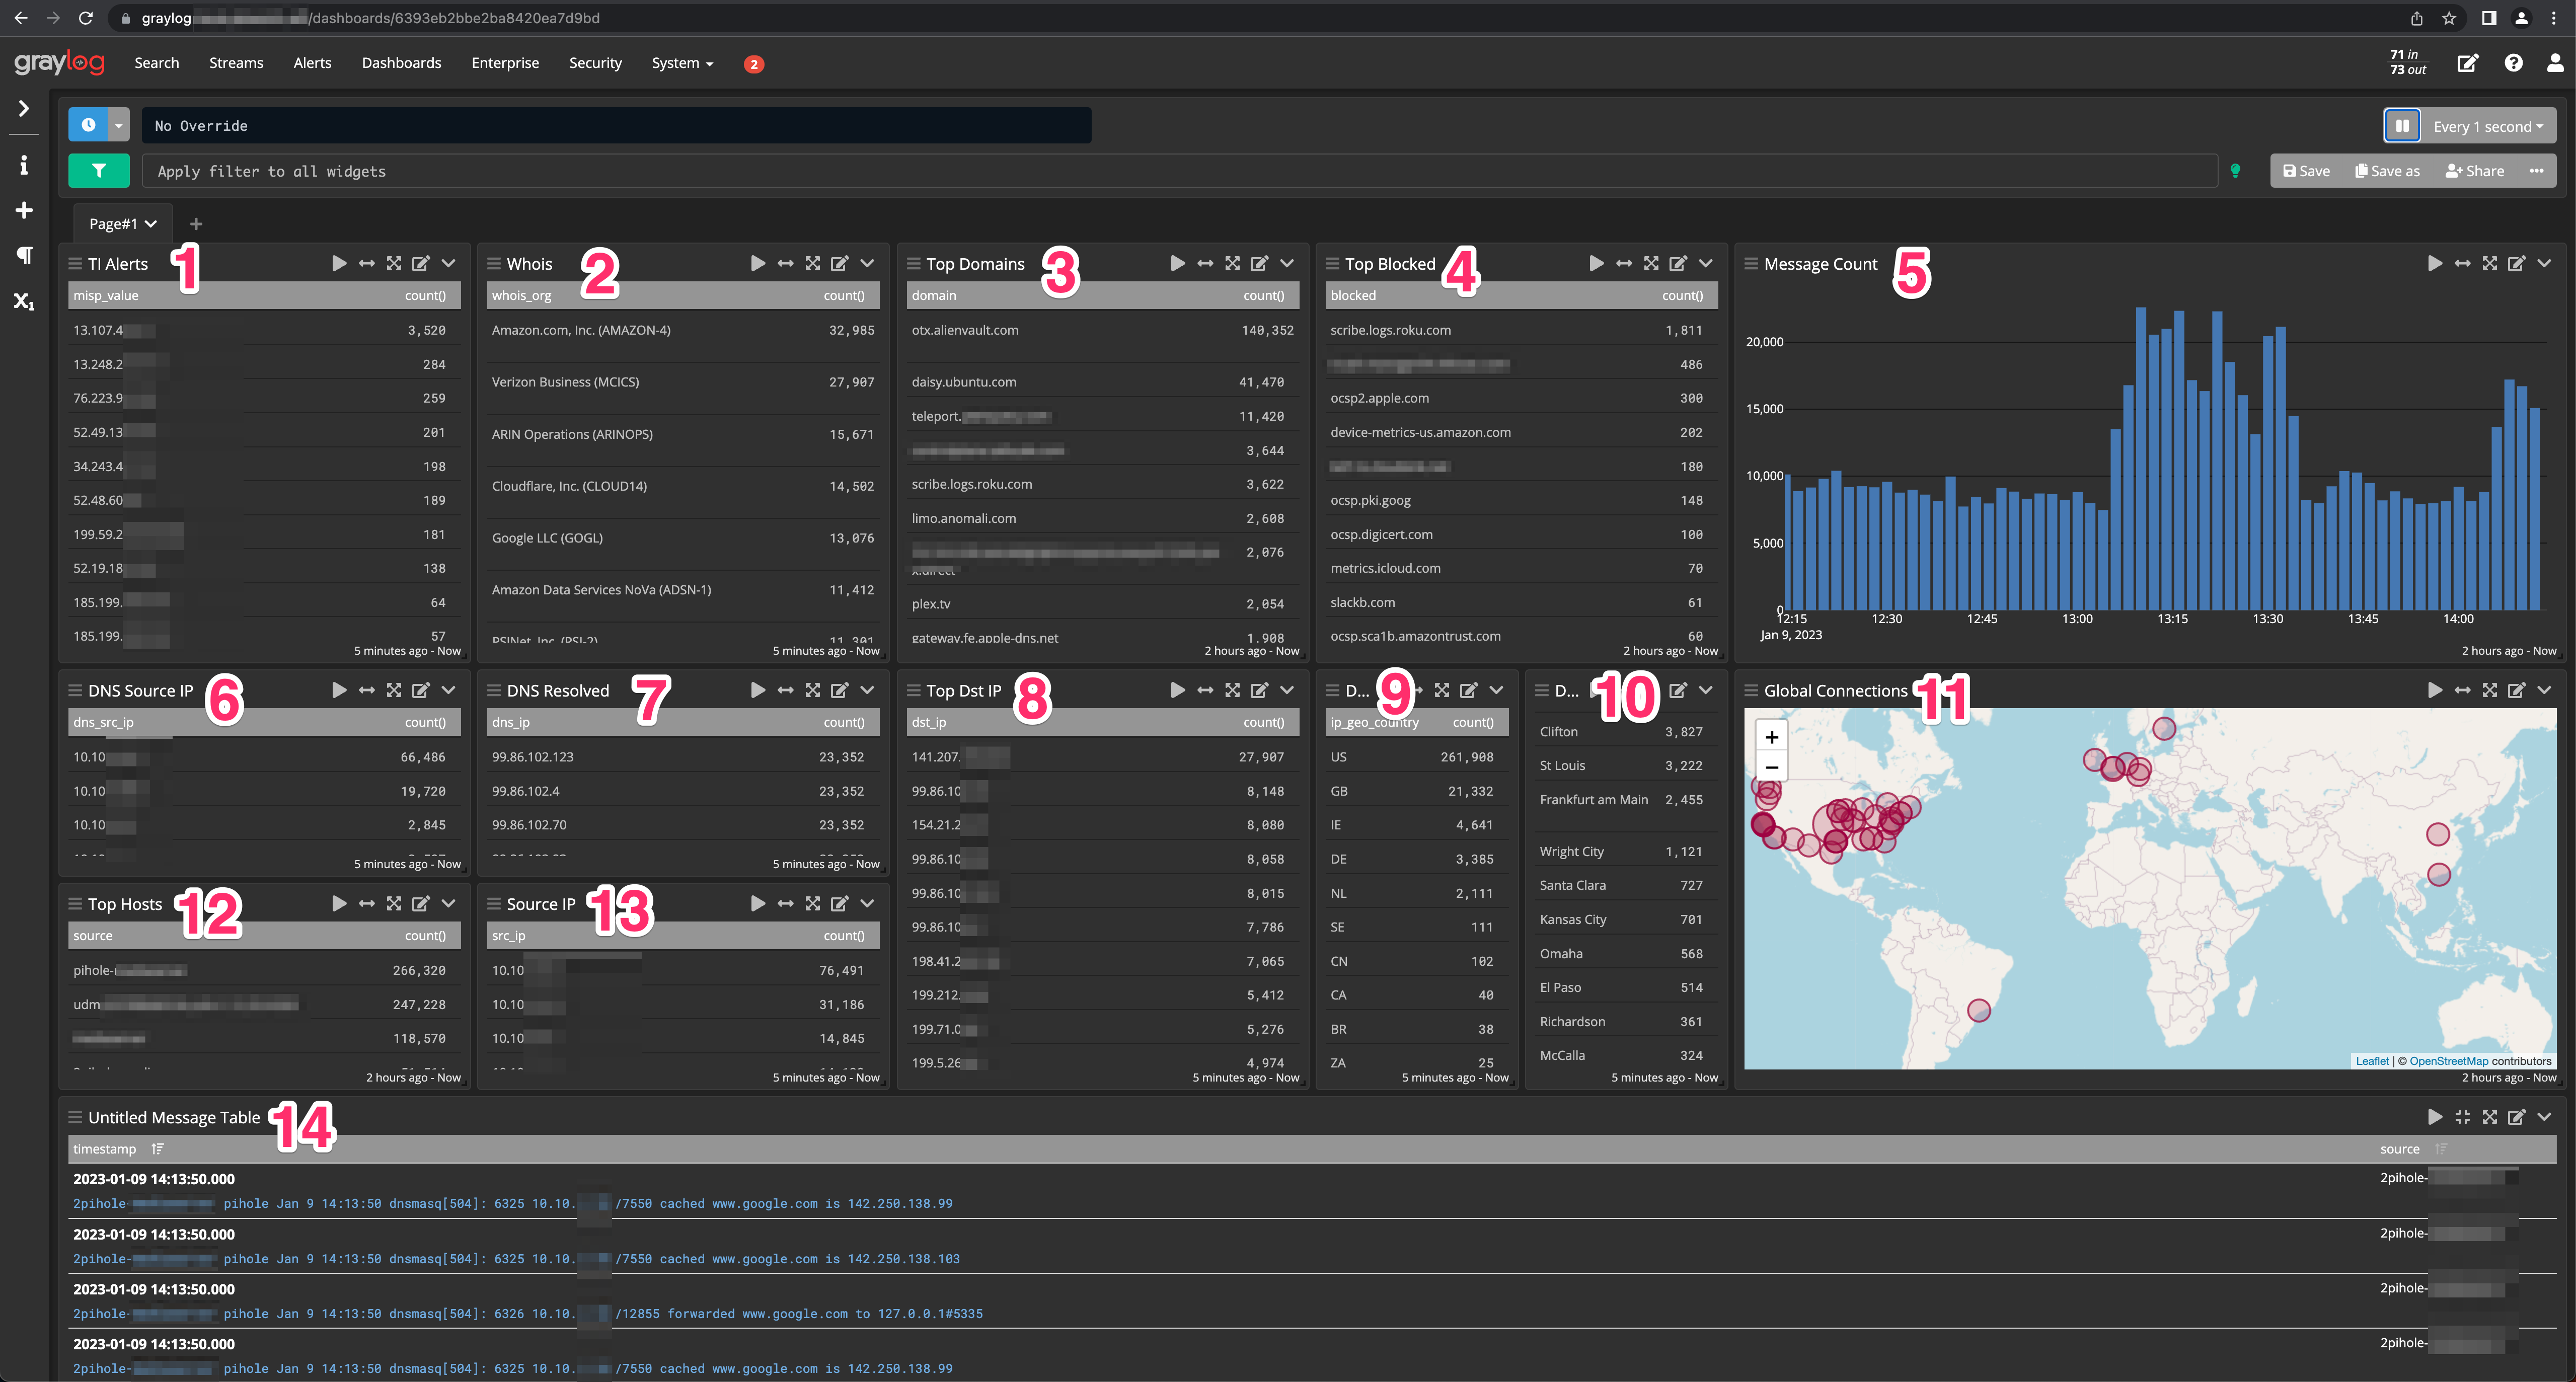
Here is a description of each of the tiles that are setup in this particular dashboard.
| ID | Description |
|---|---|
| 1 | Top IP addressed based off results from MISP lookups from Ubiquiti and Pi-Holes |
| 2 | Whois lookups for destination IP lookups from Ubiquiti |
| 3 | Top domains requested based off my Pi-Hole log data |
| 4 | Top blocked domains by my Pi-Holes |
| 5 | Message count chart for Ubiquiti and Pi-Holes |
| 6 | DNS request source IP addresses from Pi-Hole |
| 7 | DNS resolution IP address result from Pi-Hole |
| 8 | Top destination IP addresses from Ubiquiti |
| 9 | Top countries for destination IP addresses |
| 10 | Top cities for destination IP addresses |
| 11 | Geographical map for destination IP connections |
| 12 | Top hostnames making DNS requests from Pi-Hole |
| 13 | Top IP addresses making outbound connections from Ubiquiti |
| 14 | Full list of processed messages to be used for filtering and triage |
I have taken the steps to export this Content-Pack which you can use if you’d like. It is being hosted here.
This illustrates one of the beauties of Graylog: dashboards can be exported to Content-Packs. Content-Packs are also developed and shared by the Graylog community. Be sure to check out the Graylog Marketplace to see all the various dashboards and other resources the community has created and shared. Please consider sharing your own resources that you come up with!
To create your own Content-Pack, first create a dashboard. Next click System --> Content-Packs --> Create New Content-Pack.
Create a name, summary, description, vendor, and then filter and select your dashboard name. Click Next --> Next --> Create and Download.
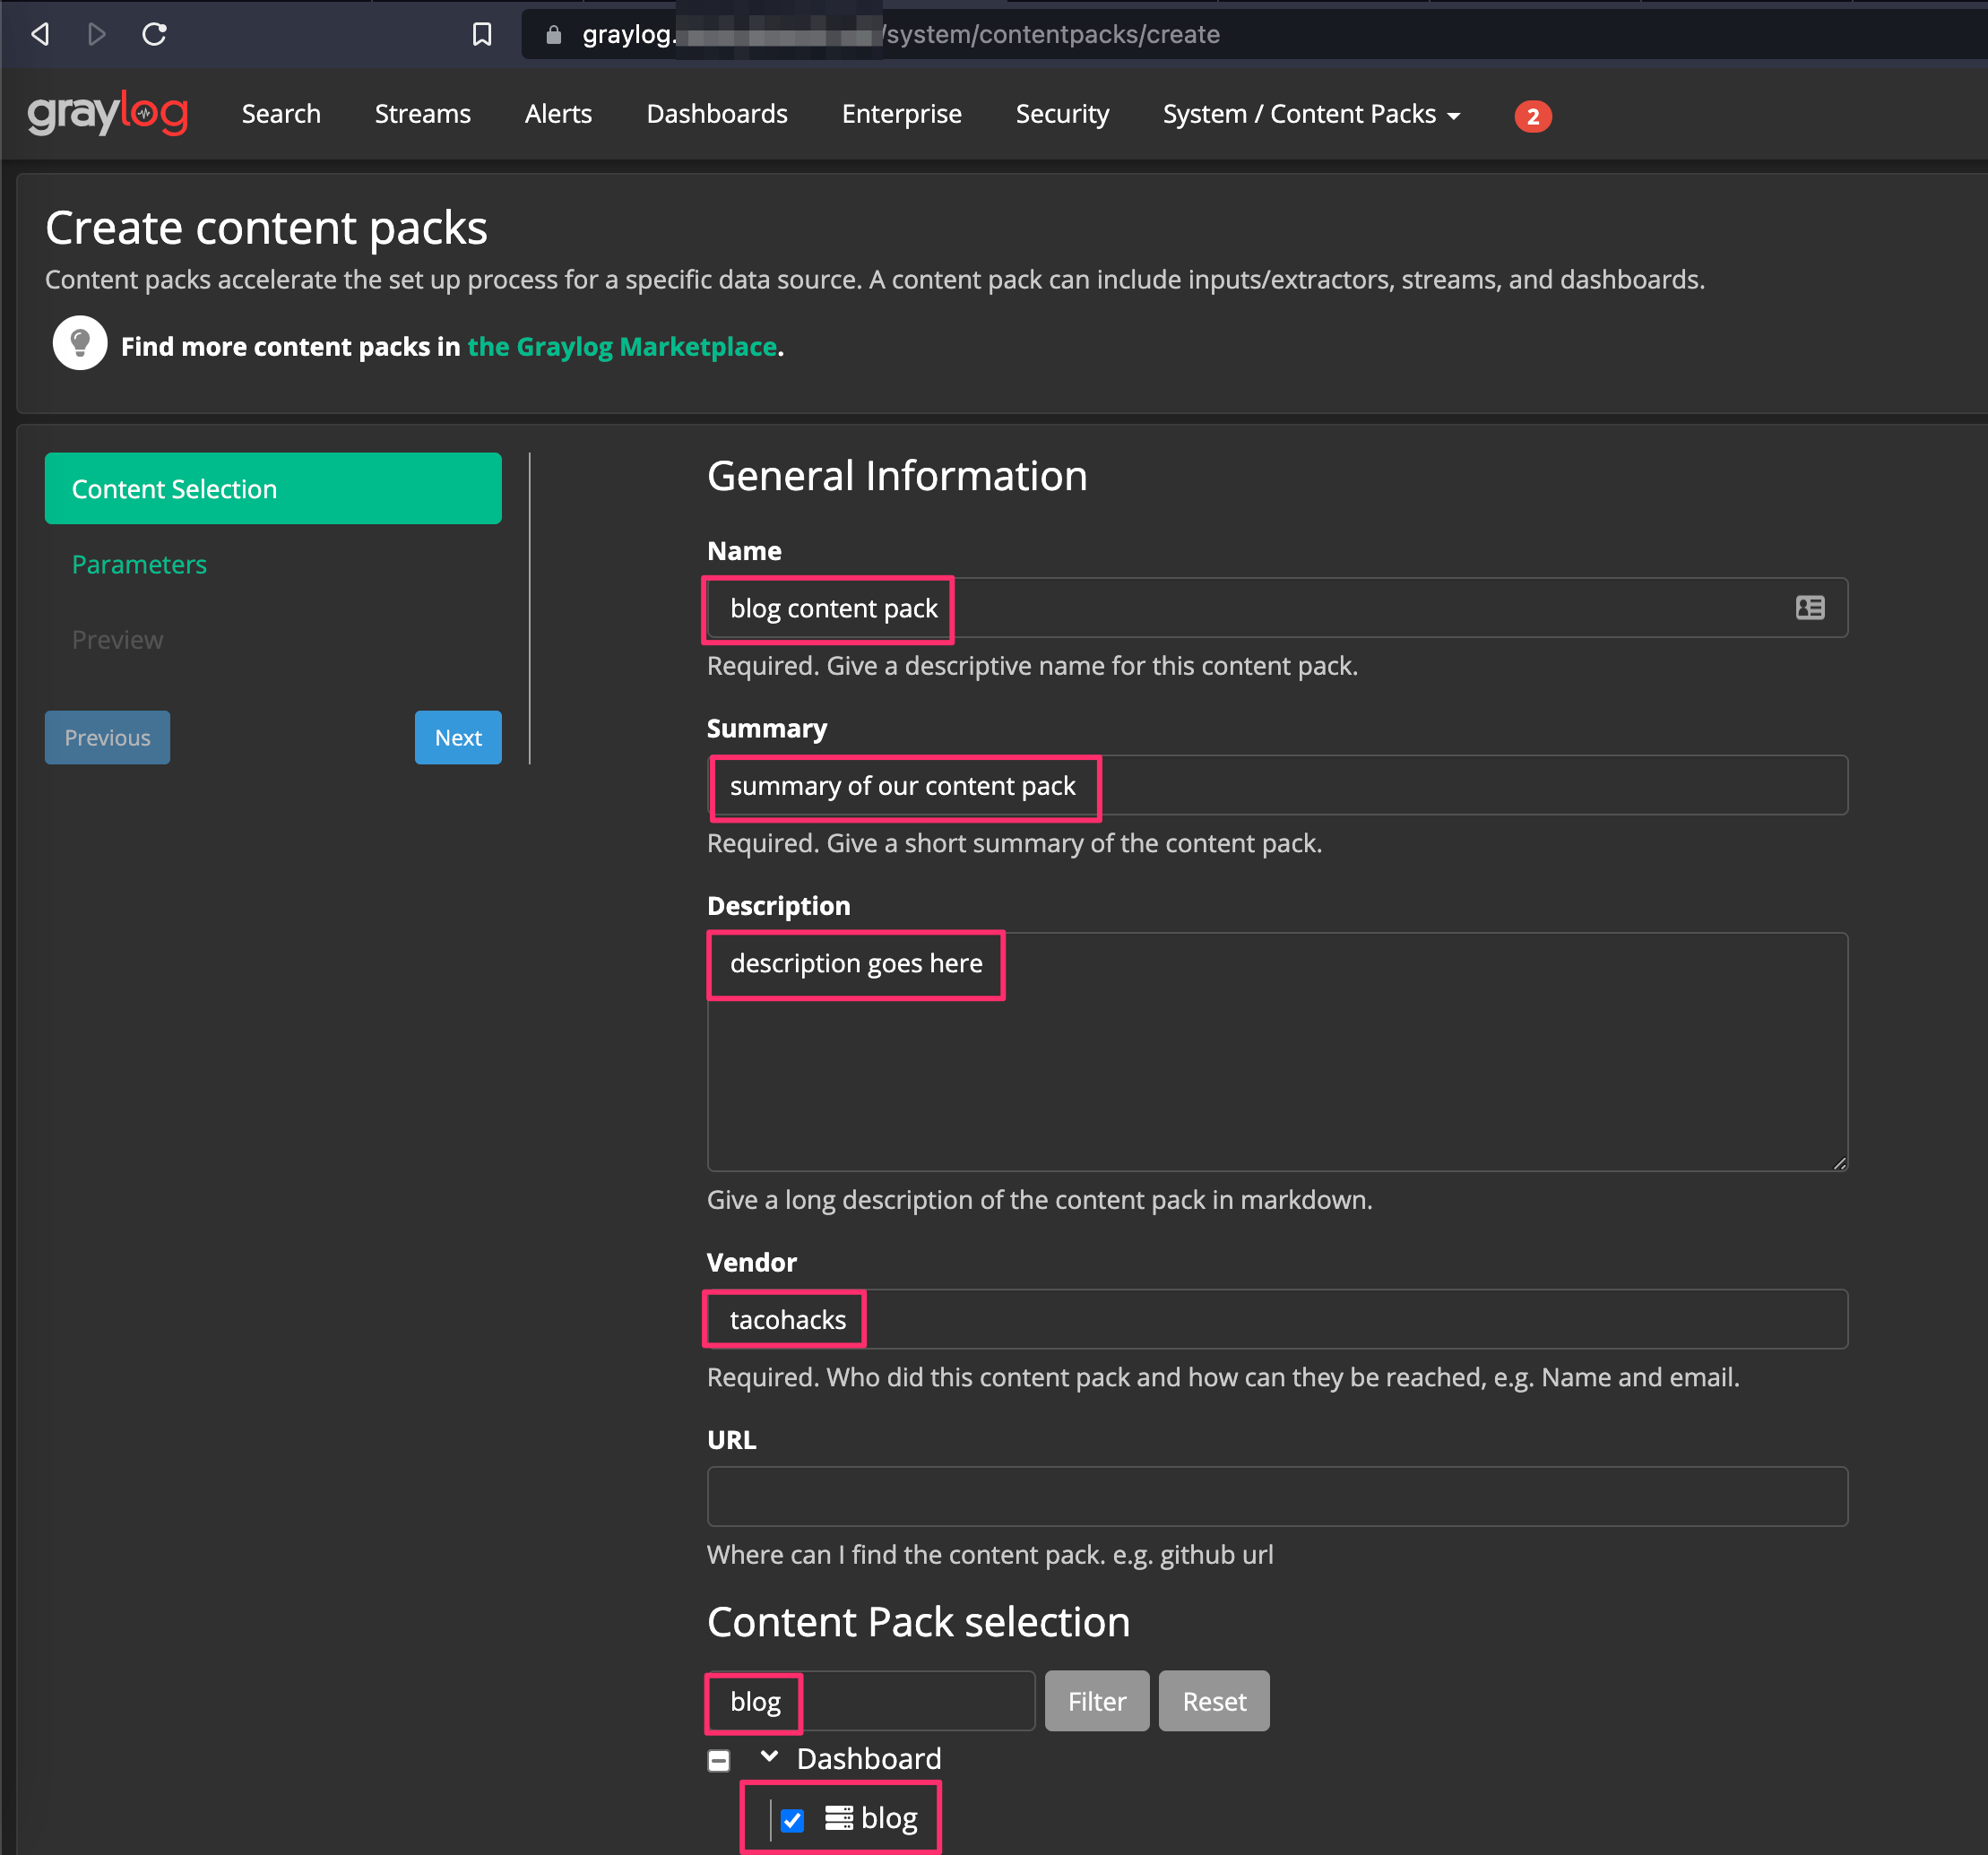
Graylog will enable you to locally download the Content-Pack in JSON format. If you’d like to import a Content-Pack, such as the Content-Pack for the dashboard I demonstrated above, download the appropriate JSON and click System --> Content-Packs --> Upload.
Alerts 🚨
What’s a SIEM system without alerts?! SIEM tuning is a full time job for many orgs with robust security programs, and for a good reason. This is where the rubber meets the road. If you have too many alerts, you’ll ignore or silence notifications. If you don’t get enough alerts, you may miss something important!
Click Alerts --> Event Definitions --> Notifications.
First we are going to define what will be sending the notifications. You have a few options here, for this example I’m going to use Slack. Follow this guide if you’ve never done this before.
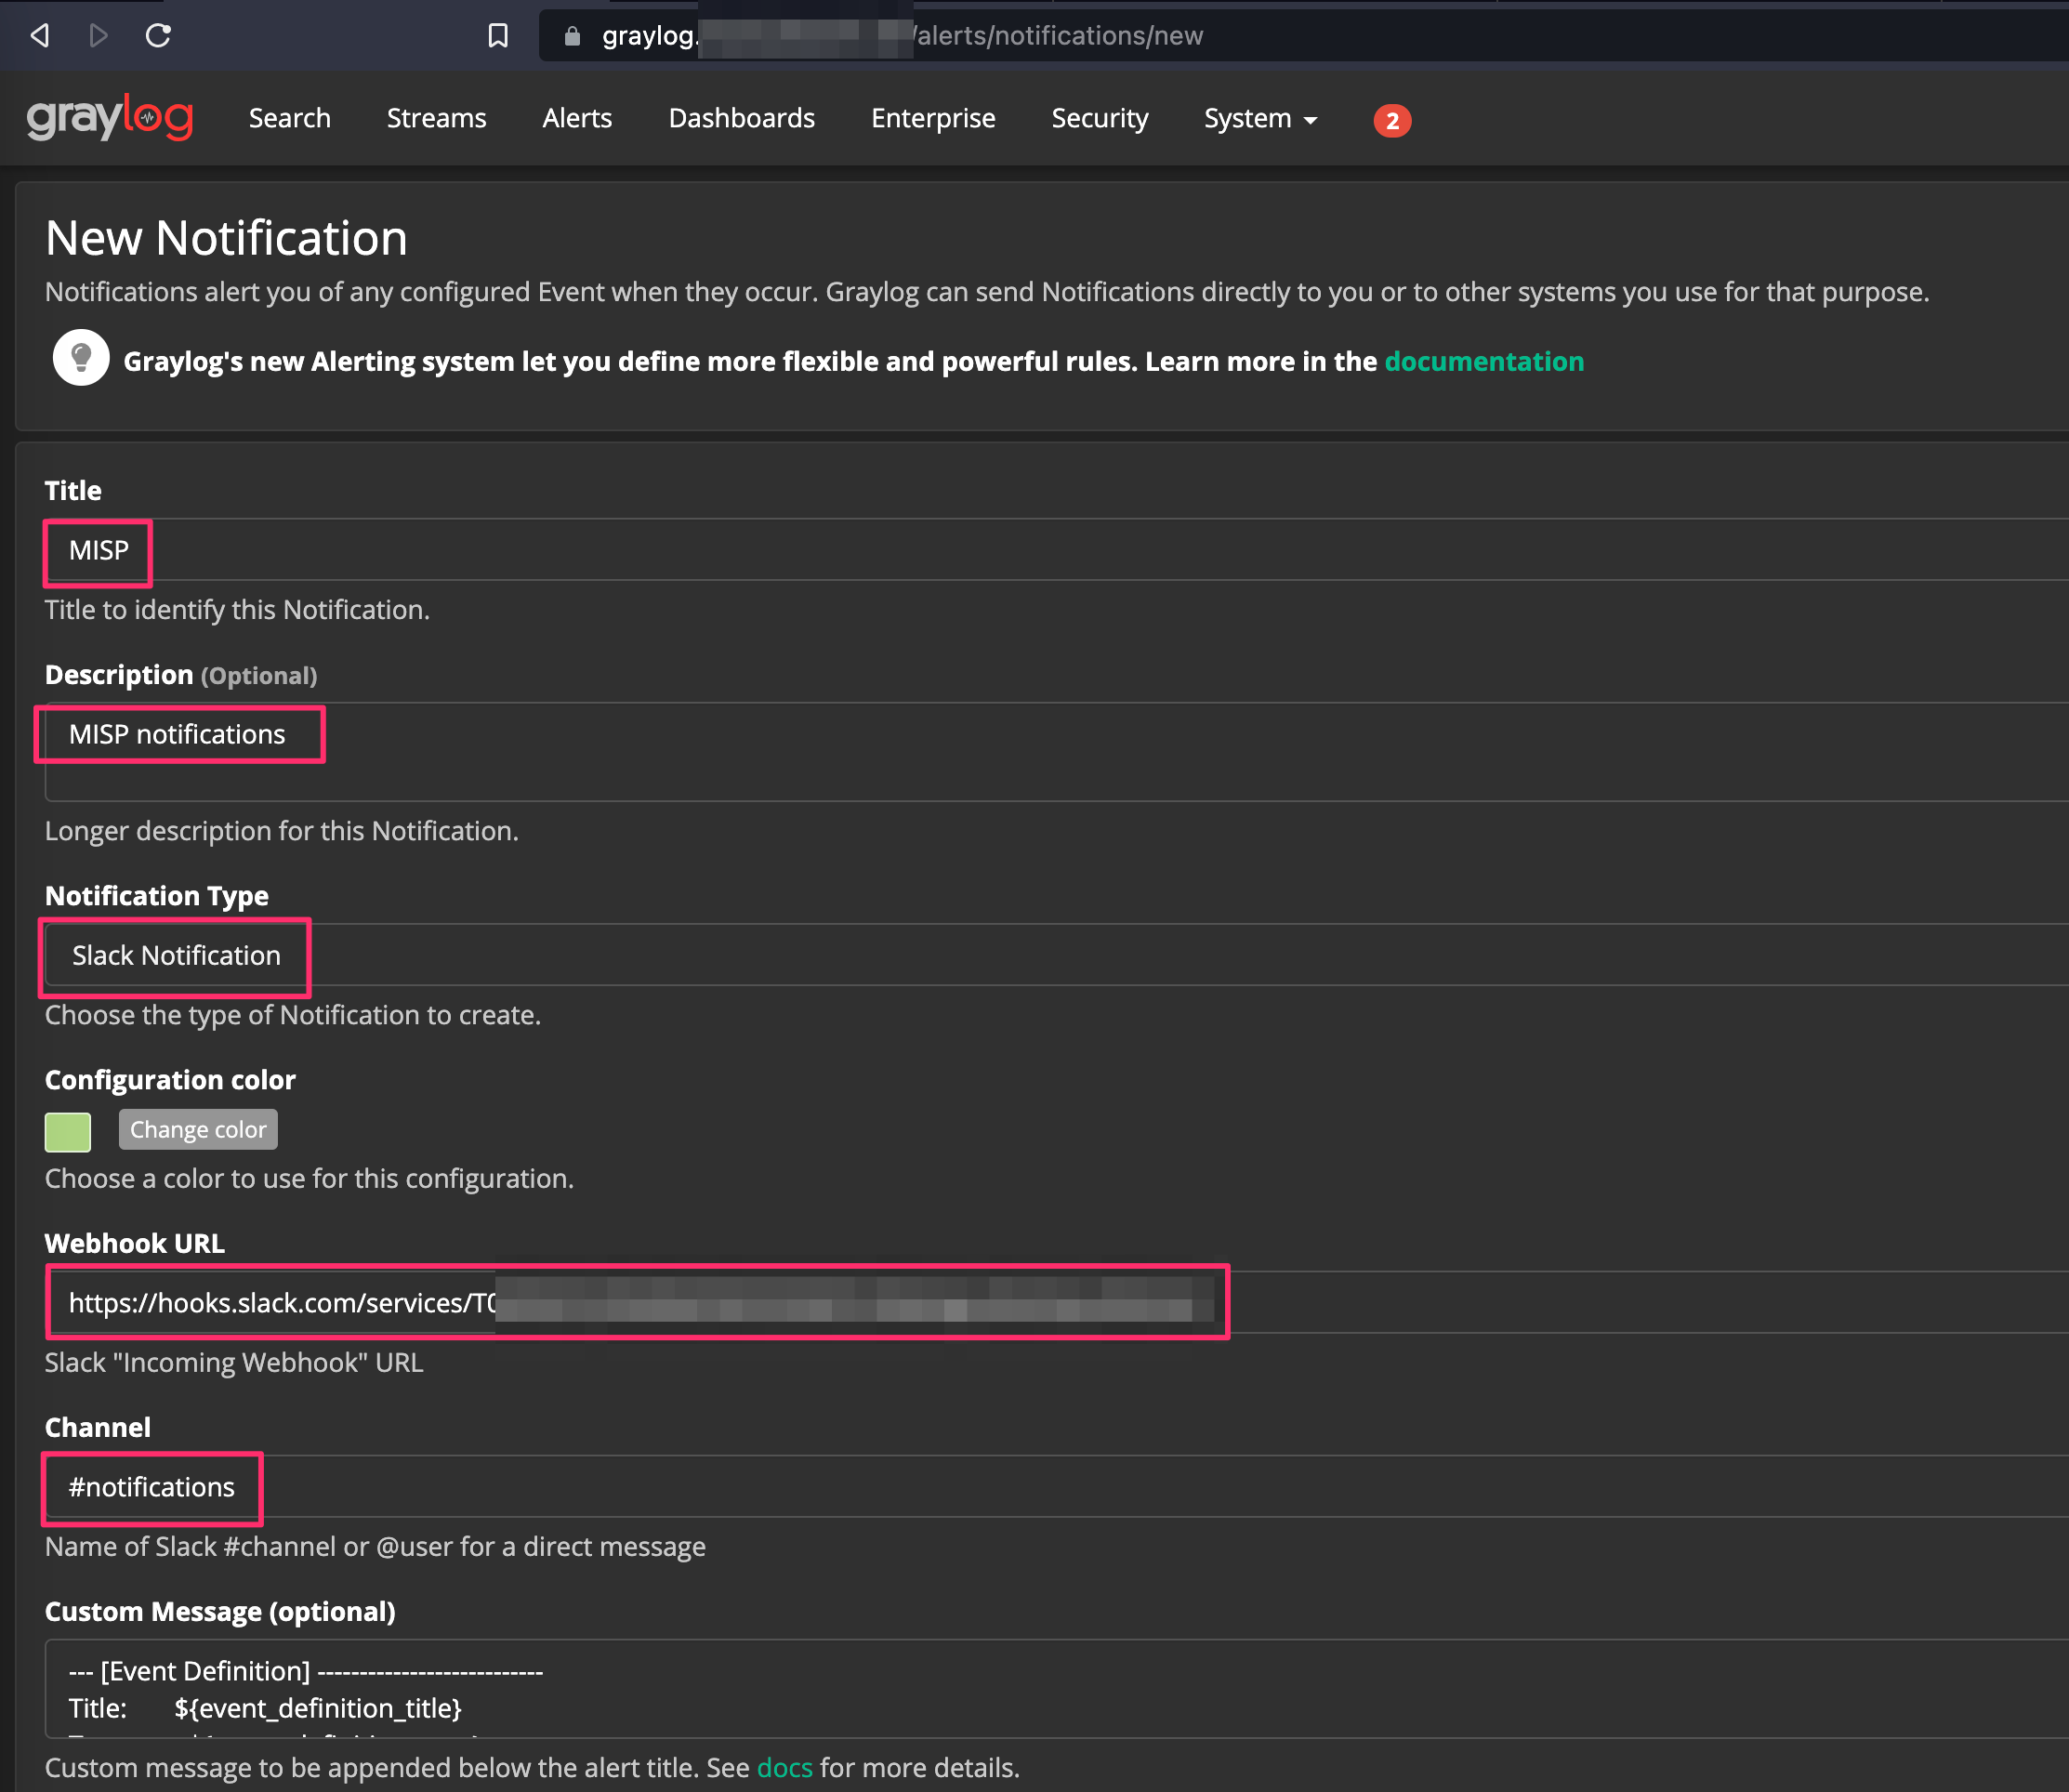
Next click Event Definitions. Here we’re going to define what will trigger the alert. Give it a meaningful title, description, and priority, and click next. Priority will be used later for a threshold for alert notifications.
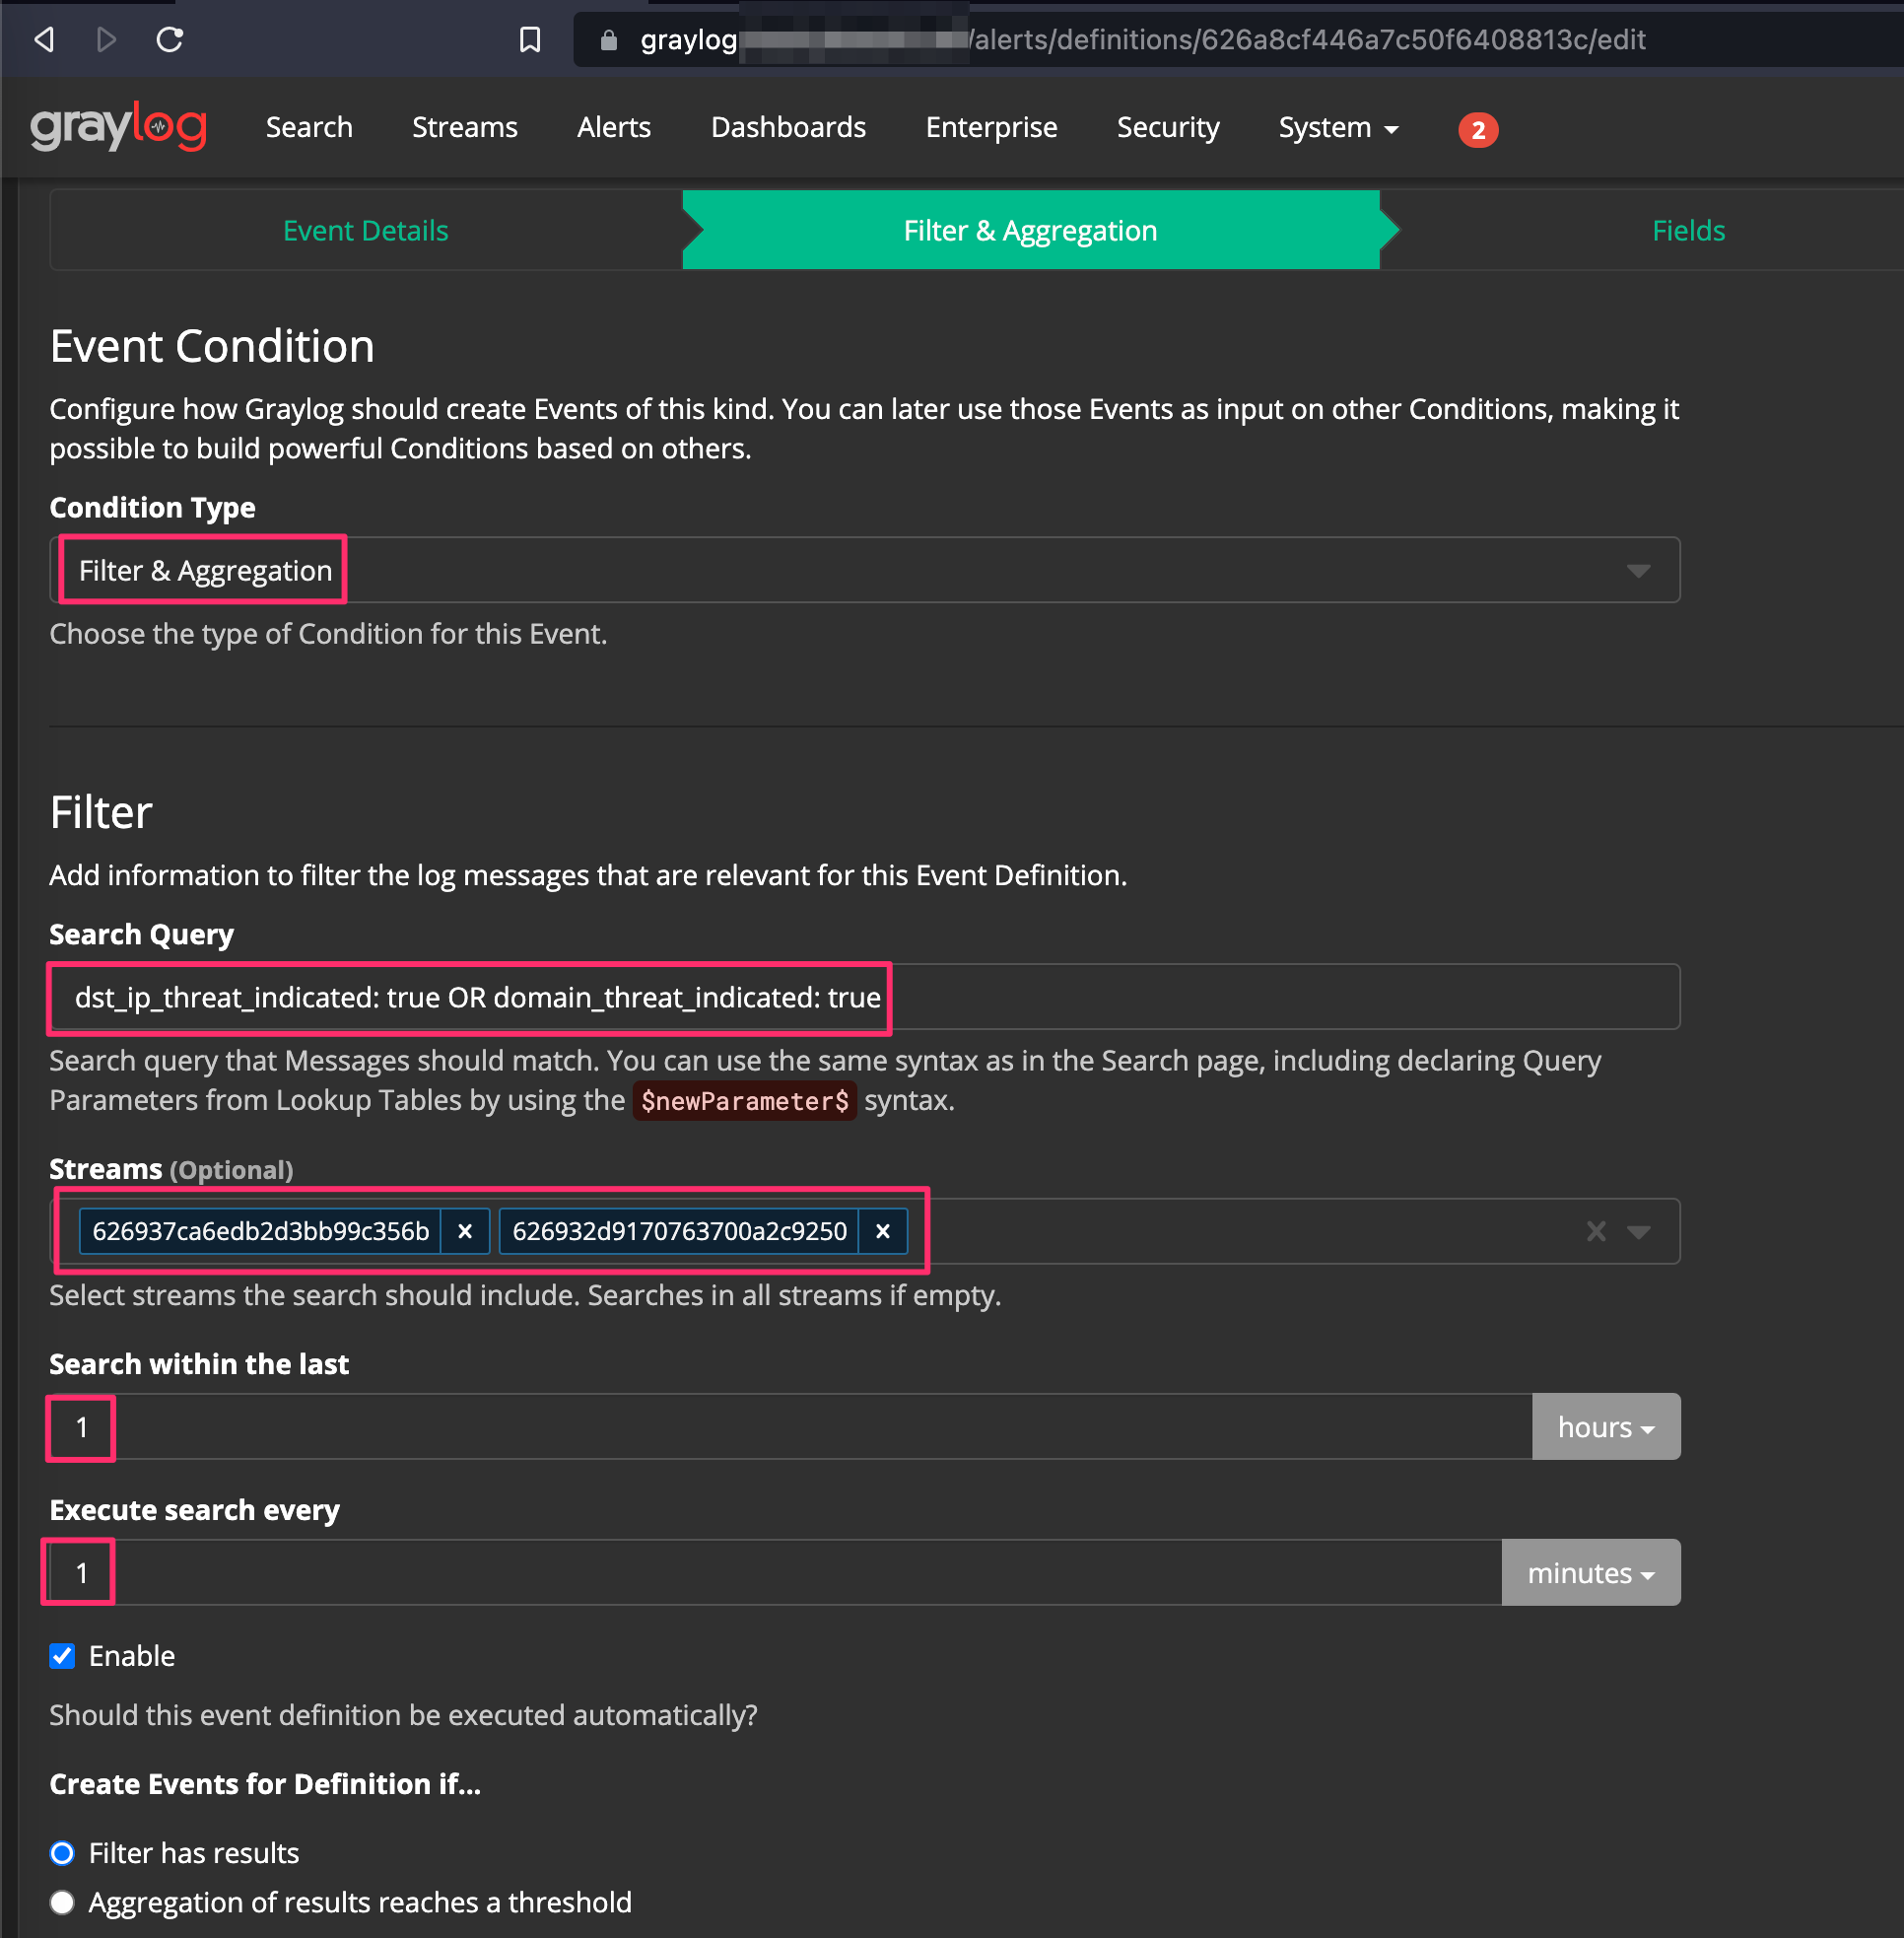
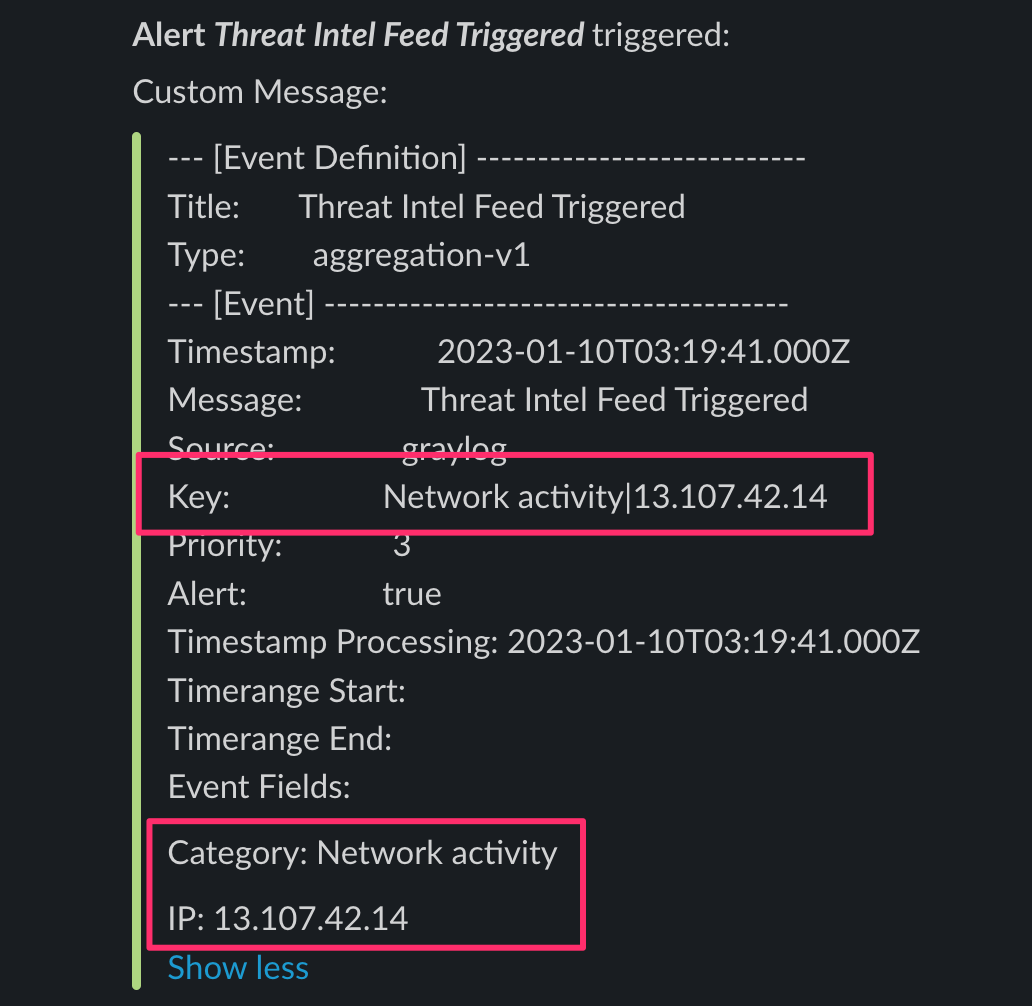
Select Filter & Aggregation from the Condition Type dropdown. I have a pipeline configured to create a field called “dst_ip_threat_indicated” and “domain_threat_indicated” if MISP returns data from Ubiquiti and Pi-Hole look ups respectively. For my setup, I submitted the following in the Search Query field: dst_ip_threat_indicated: true OR domain_threat_indicated: true . By selecting and filtering for only these values, processing is minimized to logs only containing these fields vs performing checks against all logs coming in to our system.
Then add your streams containing your data that is processed as part of your pipelines and frequency for how often the search should be executed.
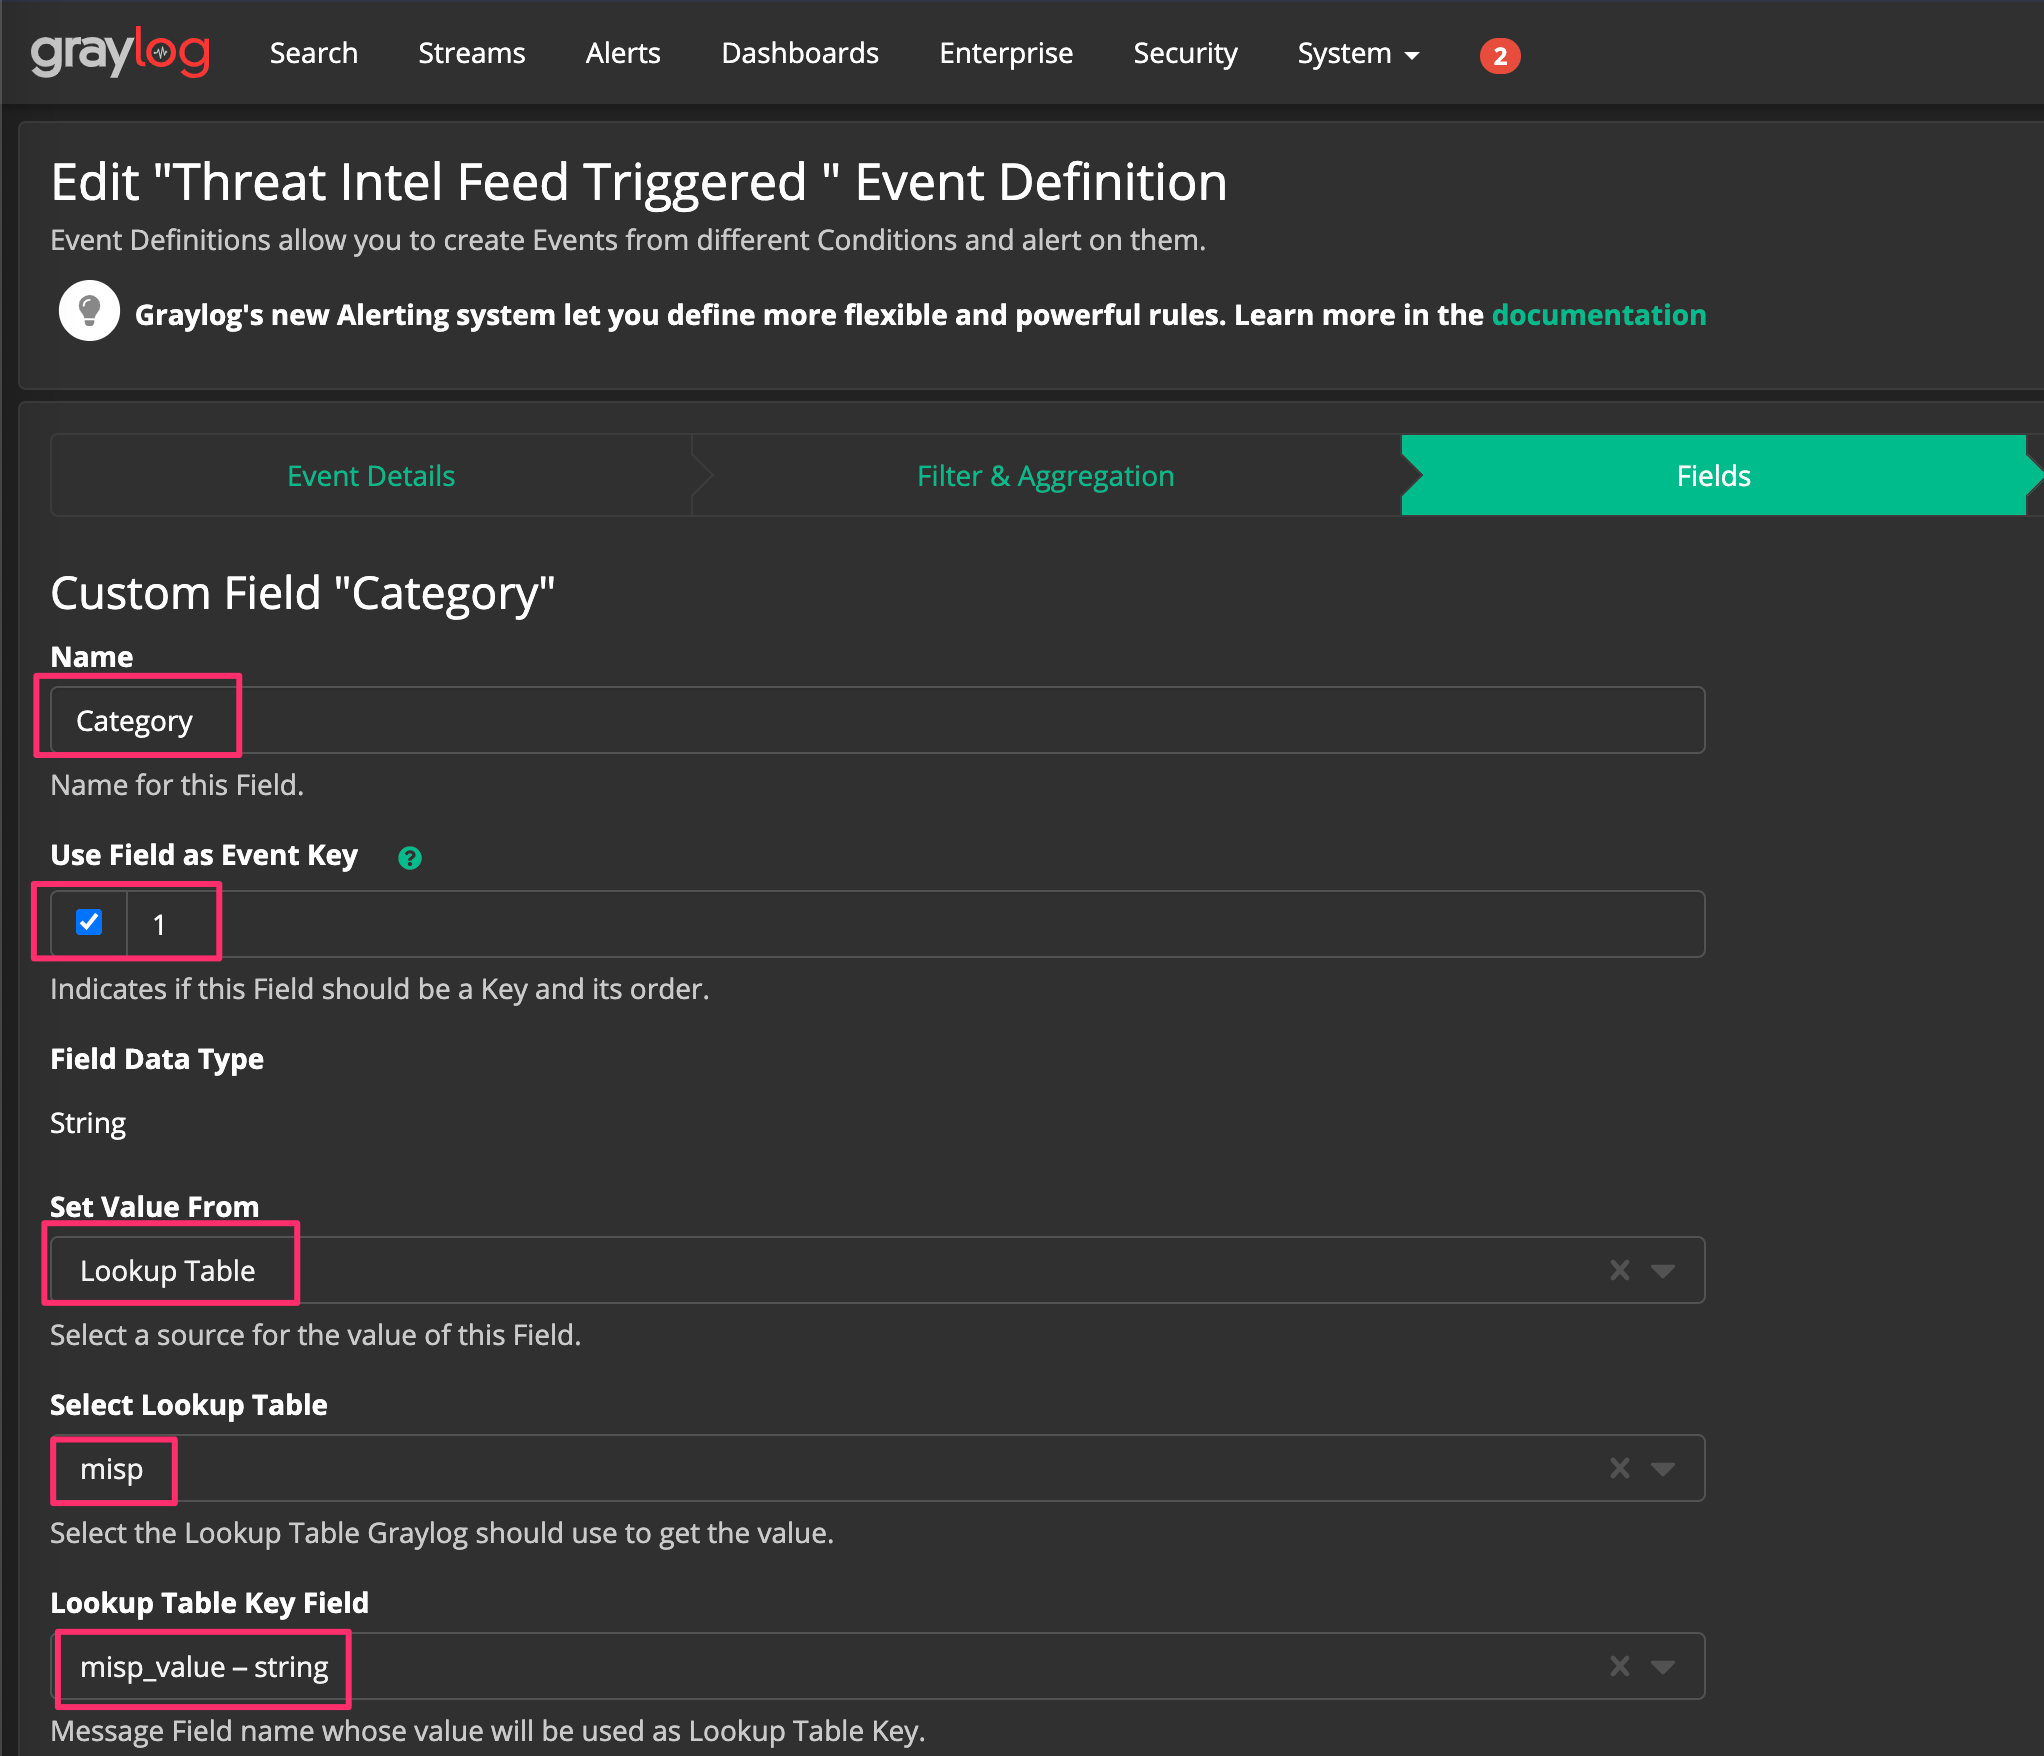
Set your name for the custom field created from the alert, Set Value From to “Lookup Table”, Select Lookup Table to “misp” (my MISP lookup table in this example), and the Lookup Table Key Field to “misp_value” which is a string.
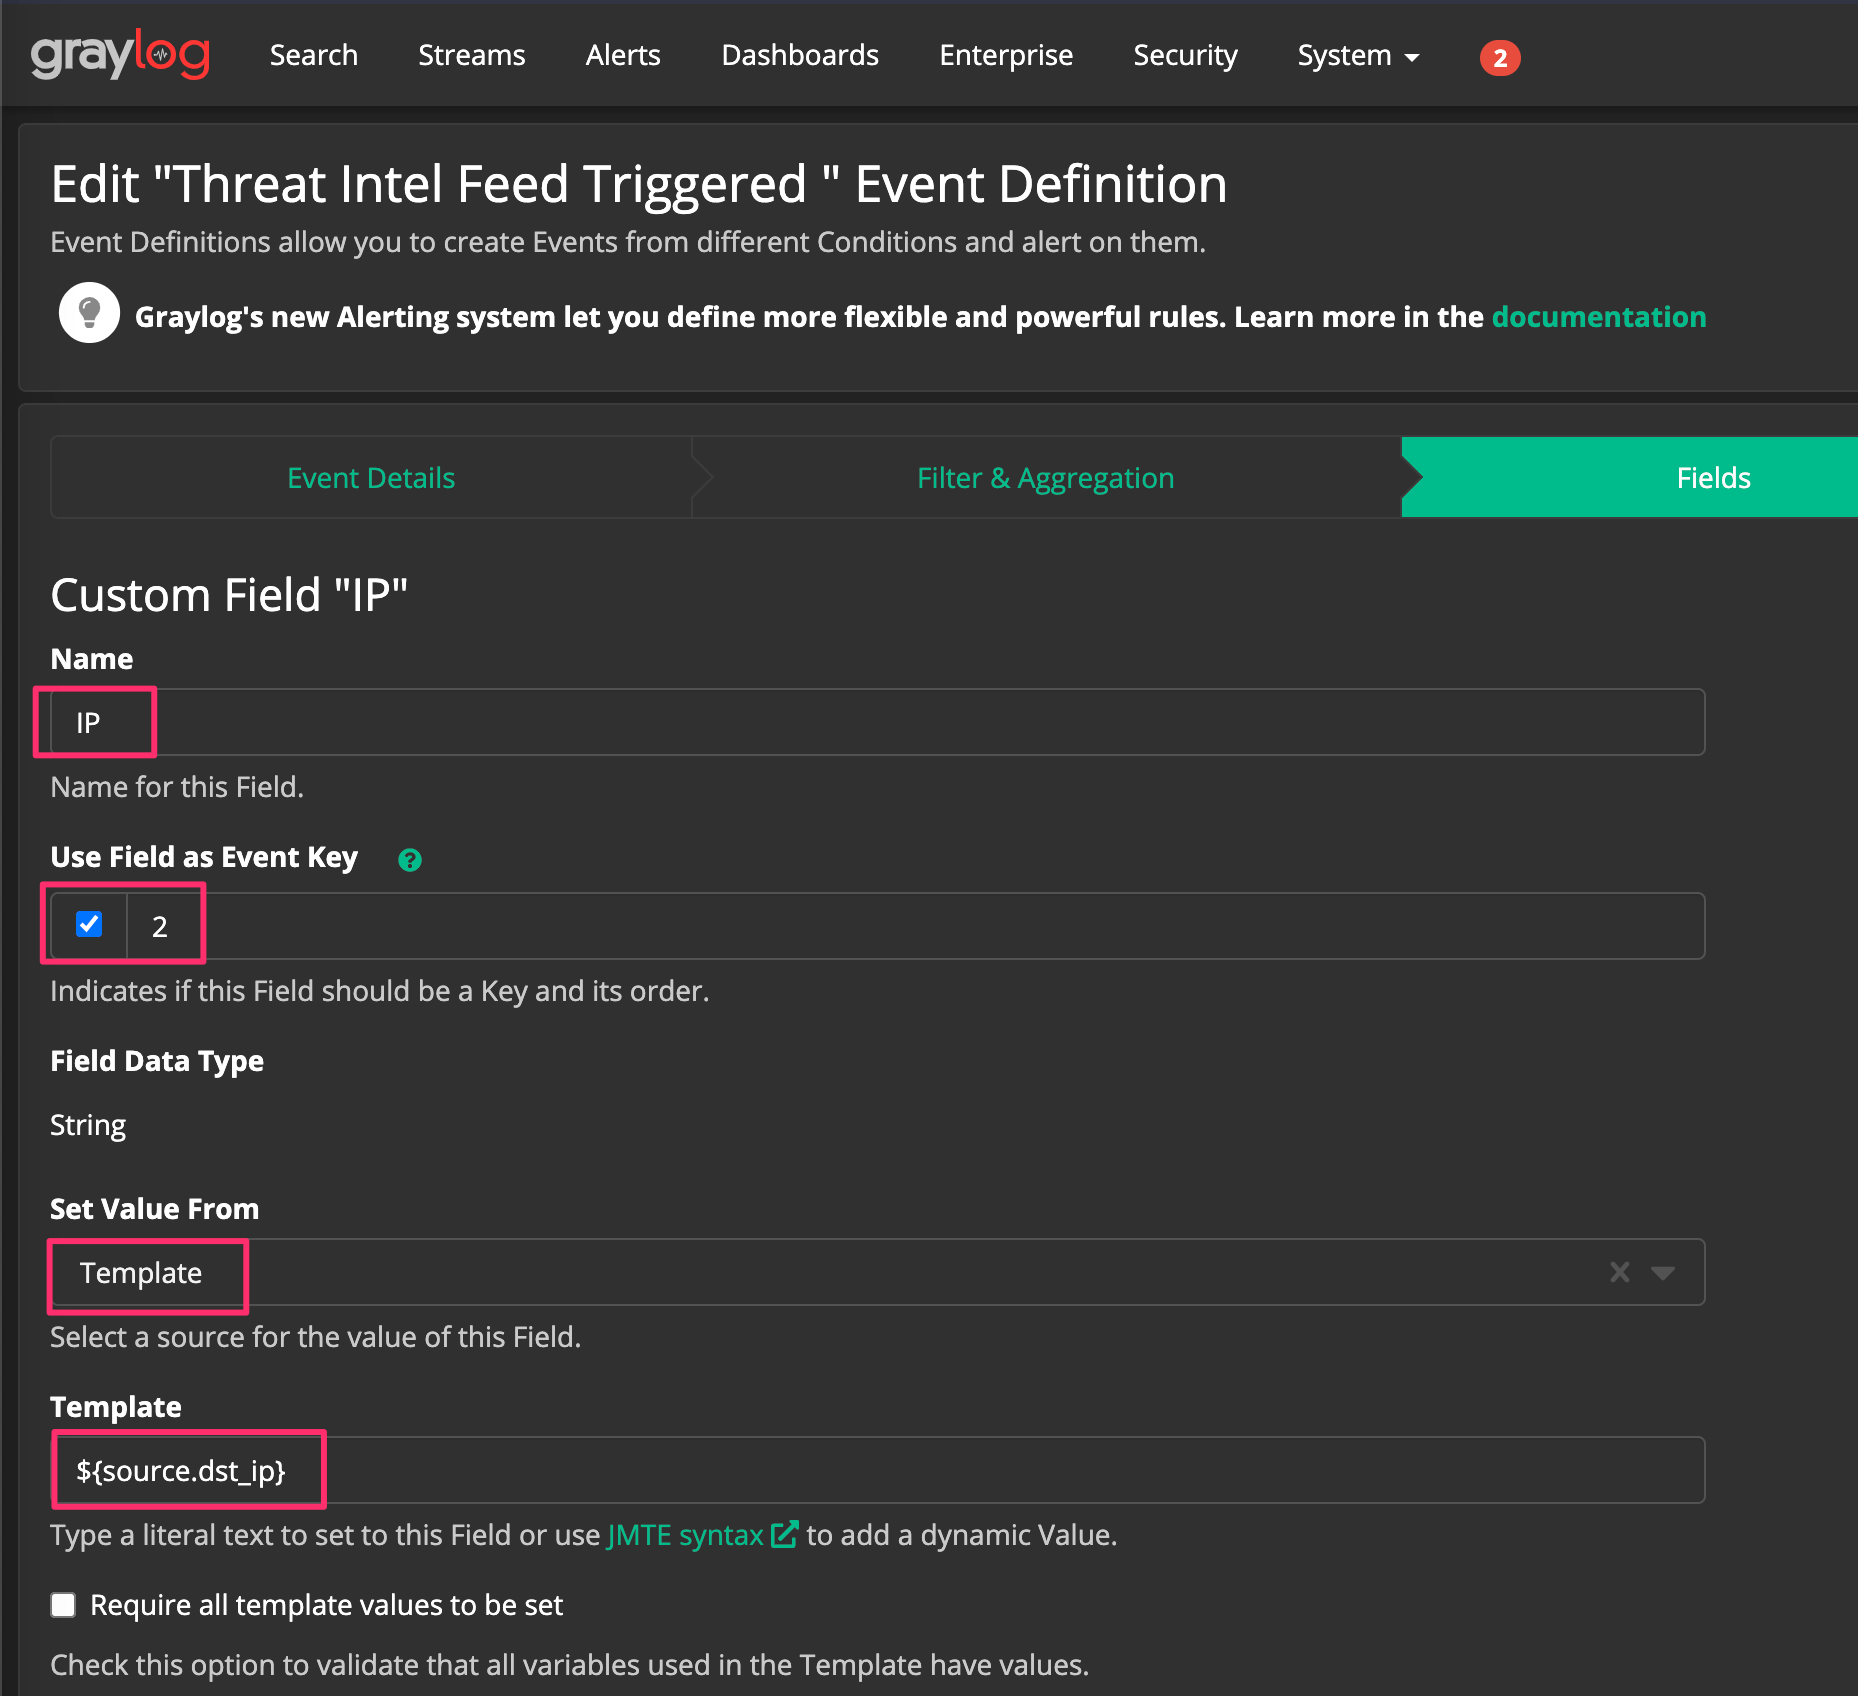
Click “Done” in the bottom left corner and click “Add Custom Field” another time. Type “IP” in Name, tick the event key check box, Set Value From to “Template” and set Template to “${source.dst_ip}”.
Select the Notification we setup before, create a grace period (avoids being overly bombarded with redundant alerts), and click done.
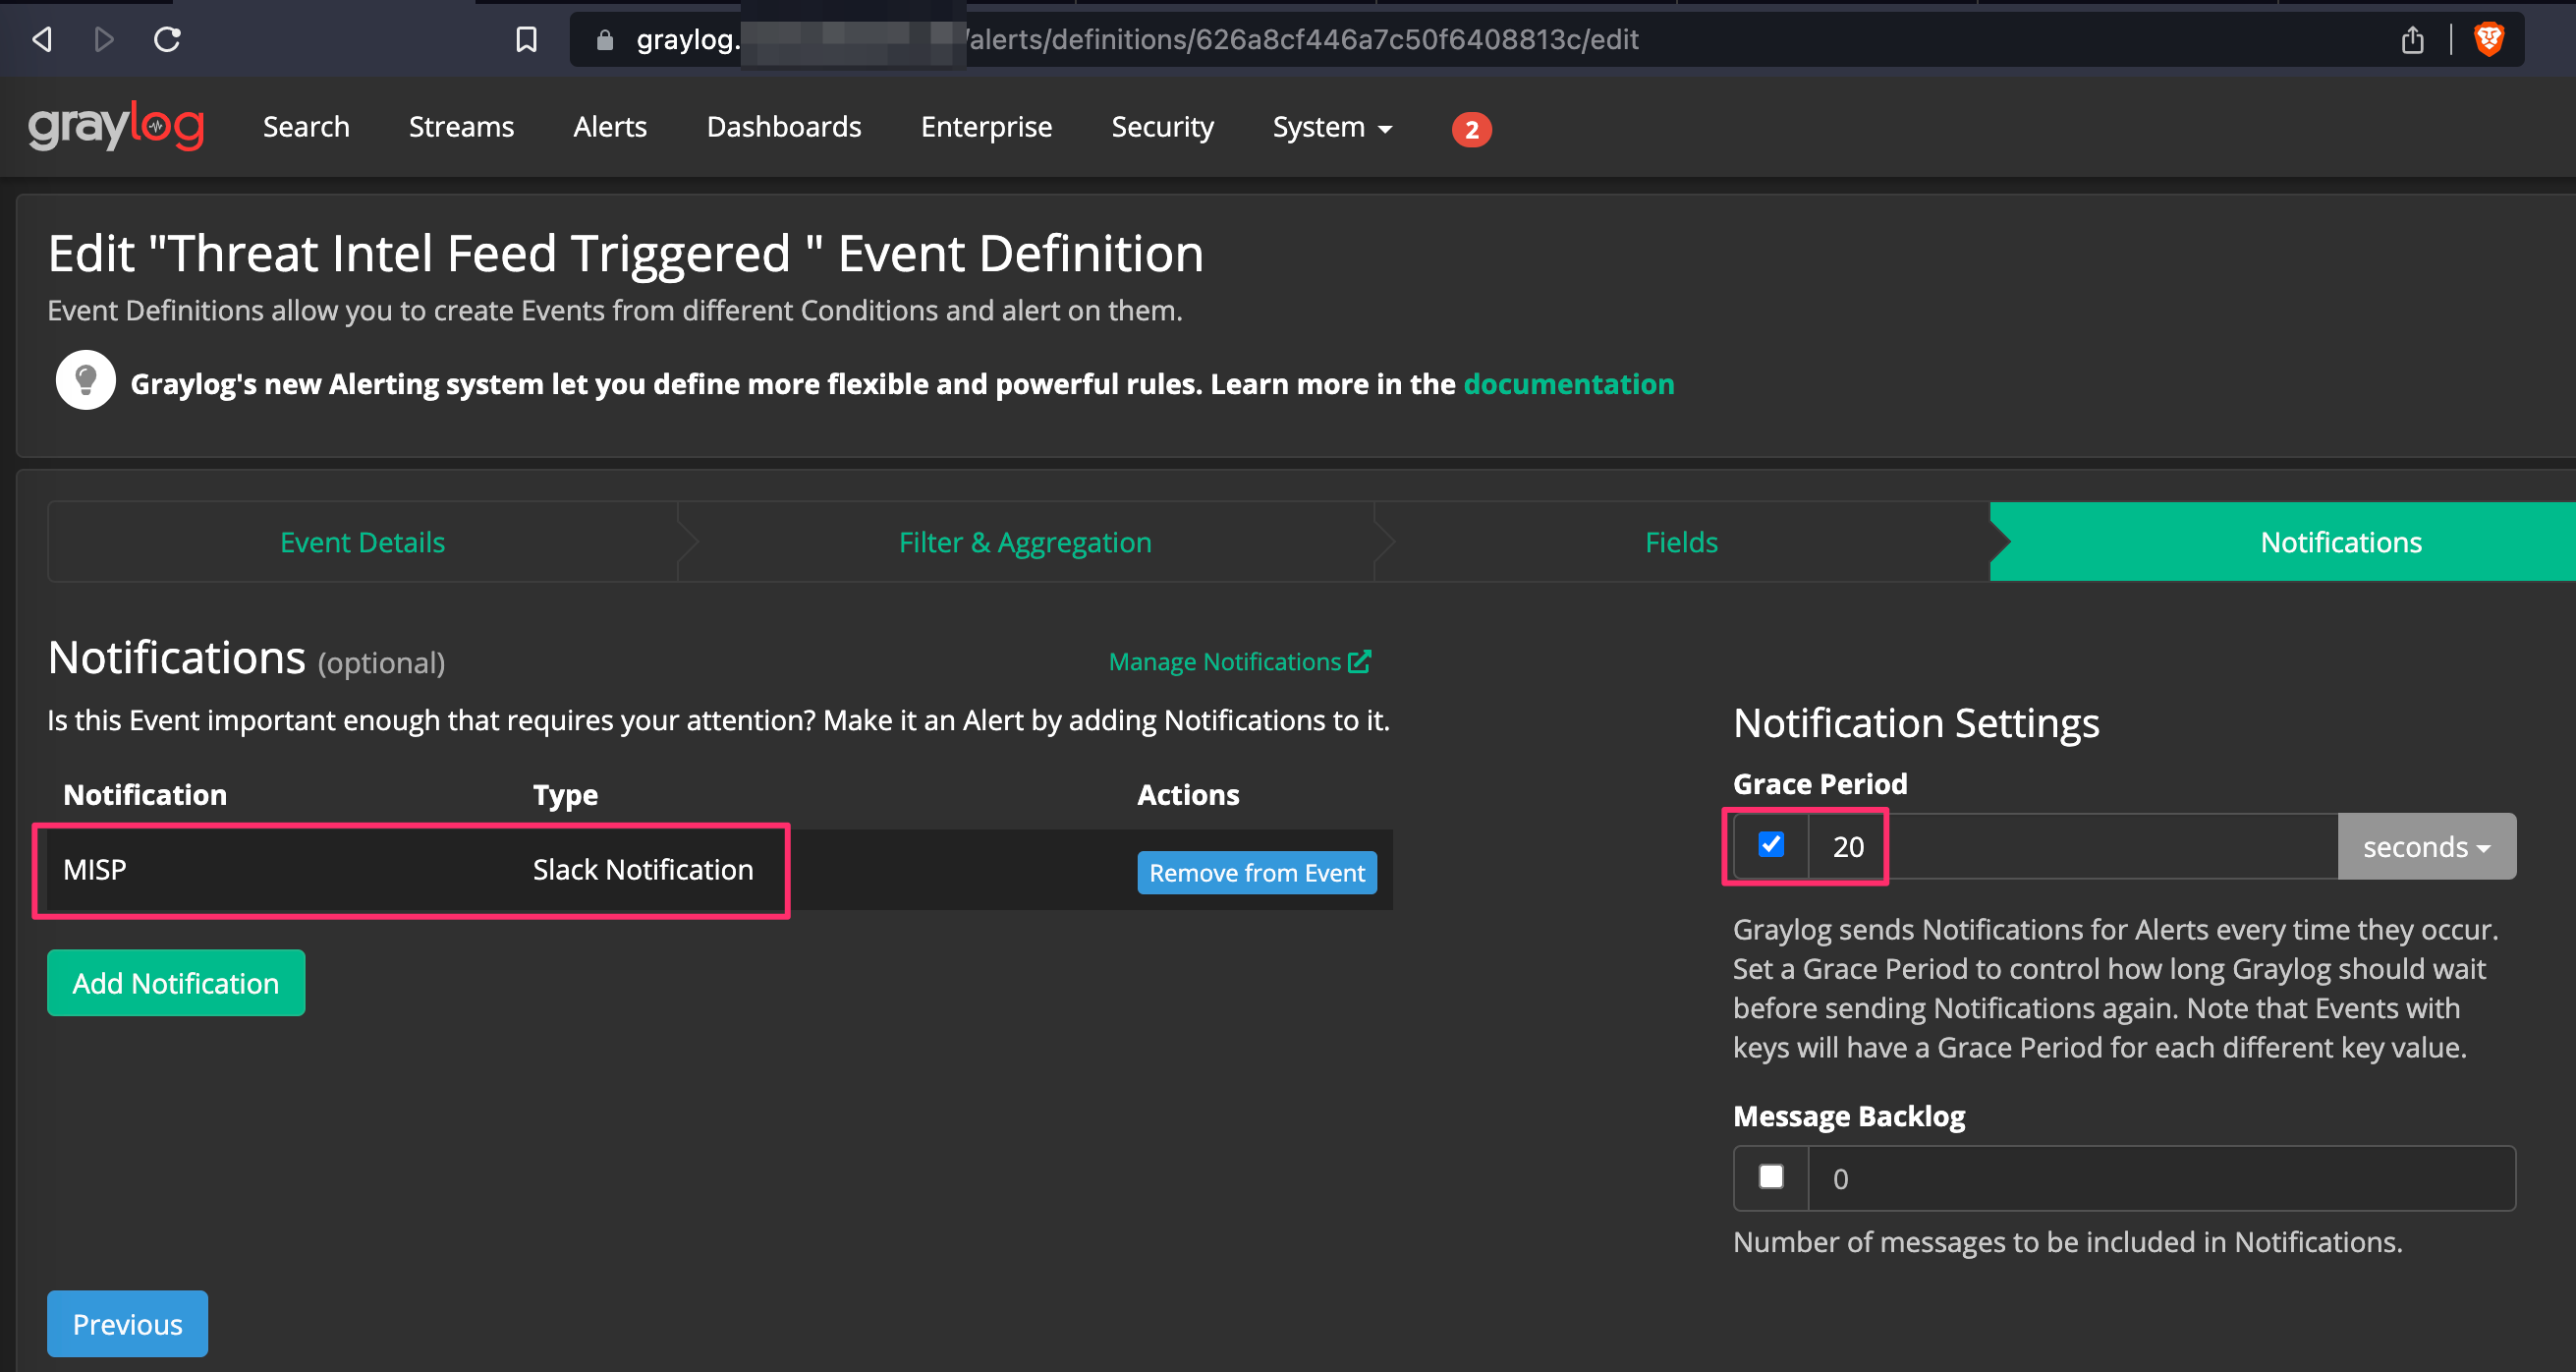
Check your Slack channel you pointed your alerts at to verify they are coming through.
What’s Next? 🤔
Now that we’ve tied the bow on Graylog, pipelines, and data tables, I’d like to move on to endpoint monitoring. For endpoint monitoring, the plan will be to look at both Graylog as well as ELK for options. For Graylog, we’ll take a look at Sidecar and Filebeat and possibly Wazuh depending on how times looking. ELK is an acronym that stands for Elasticsearch, Logstash, and Kibana. This is an open source platform that was developed by Elastic. While Graylog enables beats via sidecar, it is lacking in expandability and modulation for endpoint monitoring. While ELK has its own shortcomings, I’ve found it to be very effective for its price tag of $0.00 in our home labs.
I hope you’ve found this useful. If there’s anything more you’d like to discuss on the topics covered please drop a comment! 👇
Comments powered by Disqus.